Burndown Chart Template for PowerPoint and Google Slides
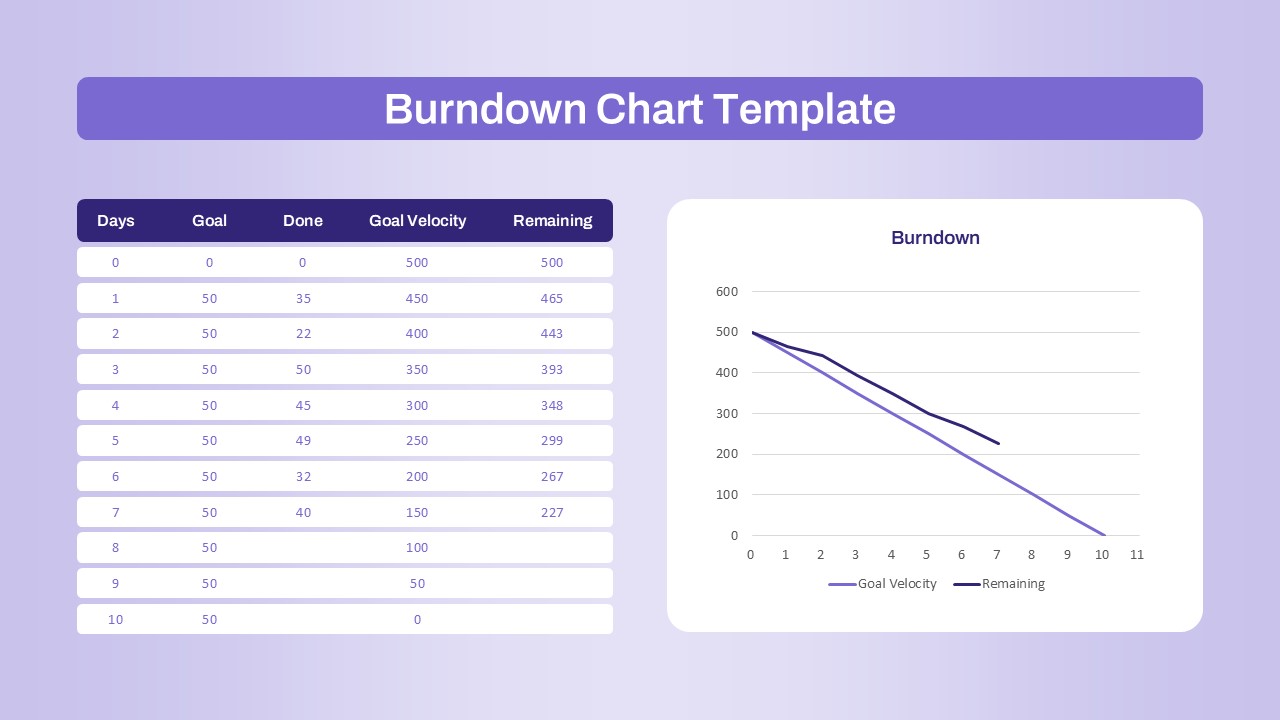
The burndown chart powerpoint is a professional and intuitive tool designed to help teams track project progress and visualize work completion over time. Perfect for Agile, Scrum, and project management settings, this template displays a clear burndown chart alongside a structured data table that logs daily progress metrics such as goal, tasks done, goal velocity, and remaining work.
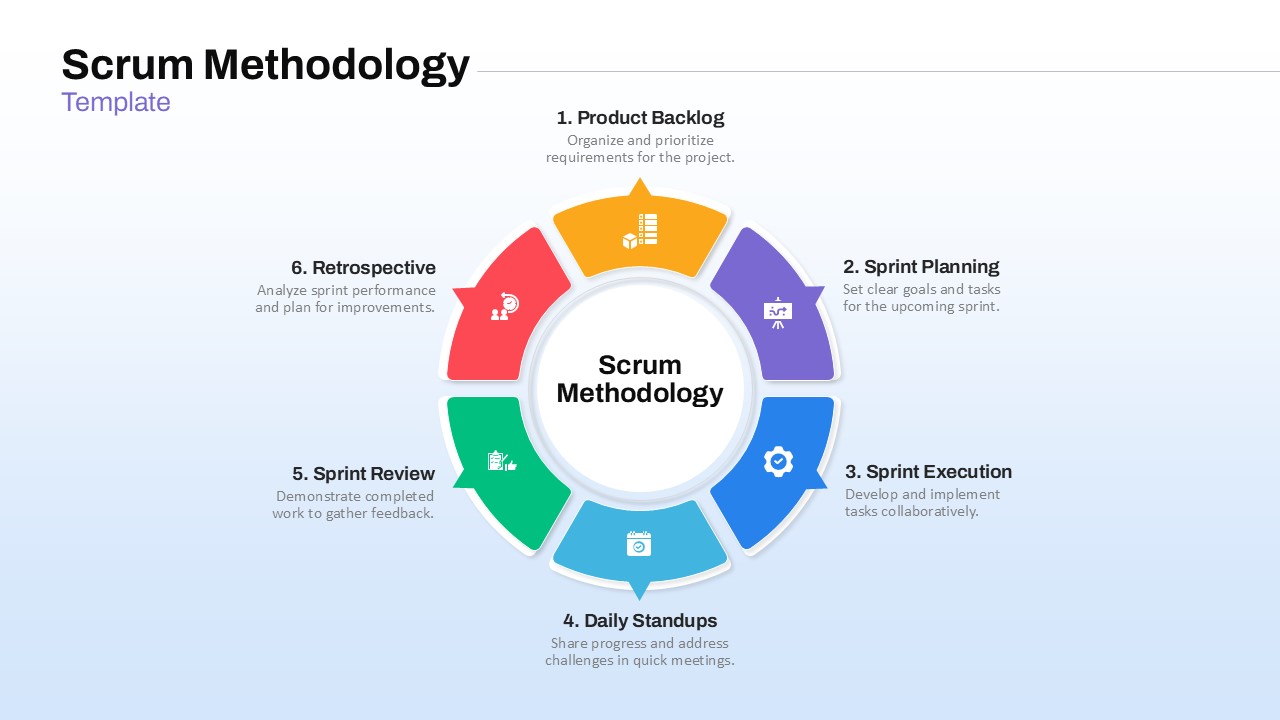
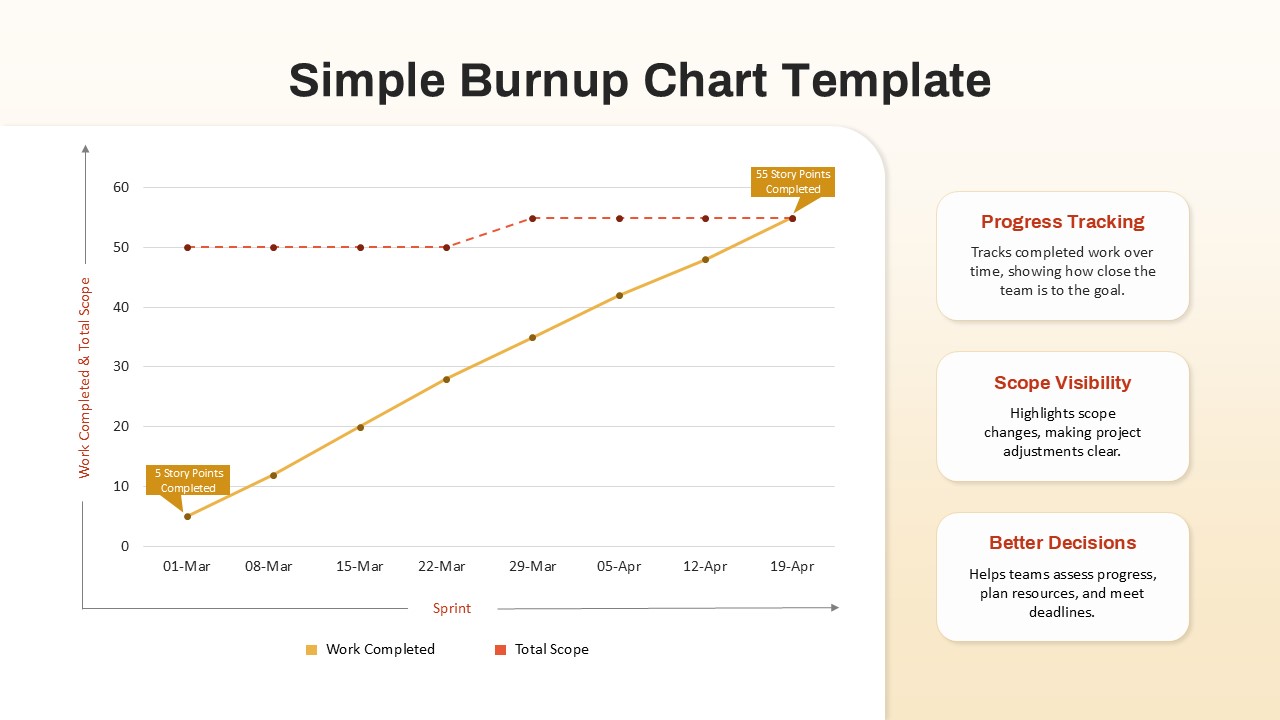
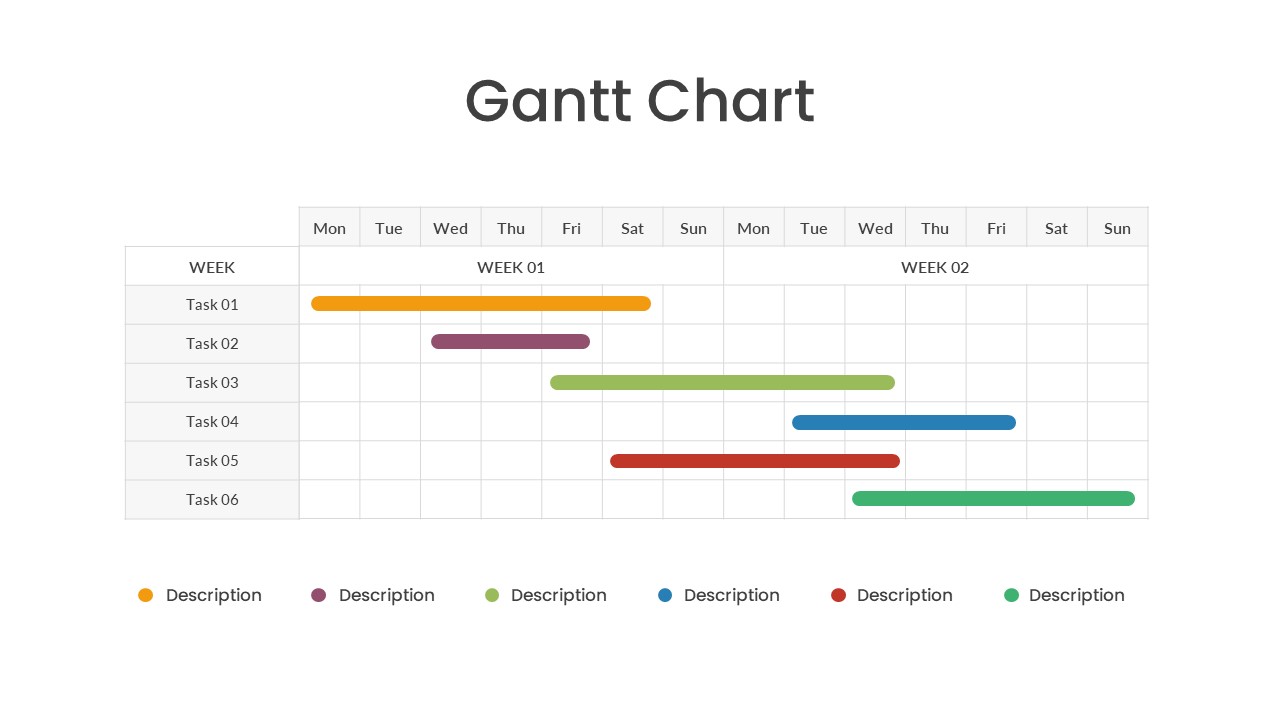
This slide visually compares the ideal task completion trajectory (goal velocity) against the actual progress (remaining work), helping teams identify performance gaps and adjust strategies accordingly. The line graph provides an at-a-glance view of productivity trends, which is especially useful during stand-ups, sprint reviews, or stakeholder meetings.
With its clean, minimalist layout and well-organized data structure, this template allows for effortless customization and integration into broader project documentation or status reports. It’s particularly effective for demonstrating accountability, forecasting delivery timelines, and ensuring transparency within teams and across departments.
Whether you’re a Scrum Master, project manager, product owner, or team lead, this burndown chart template simplifies progress tracking and supports data-driven decision-making. It’s a must-have slide for showcasing team efficiency and sprint outcomes in a professional format.
See more

Aspect Ratio
16:9Item ID
SKT03594
Features of this template
Other User Cases of the Template
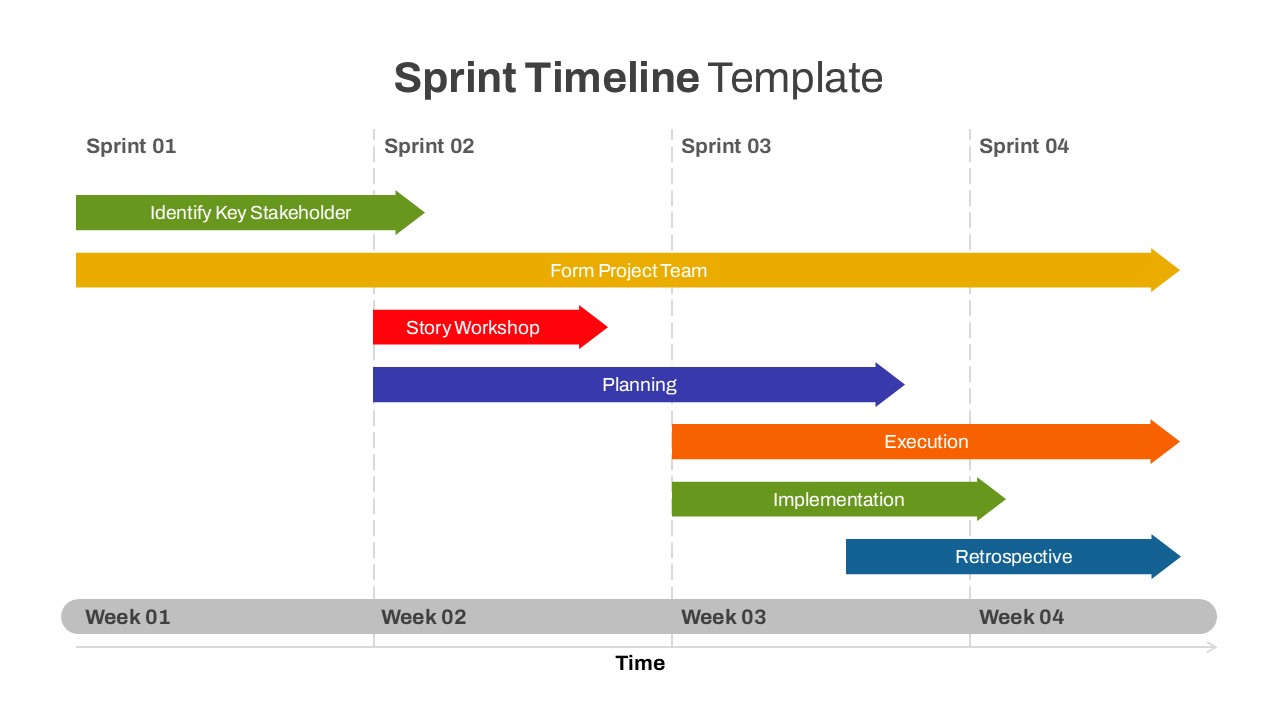
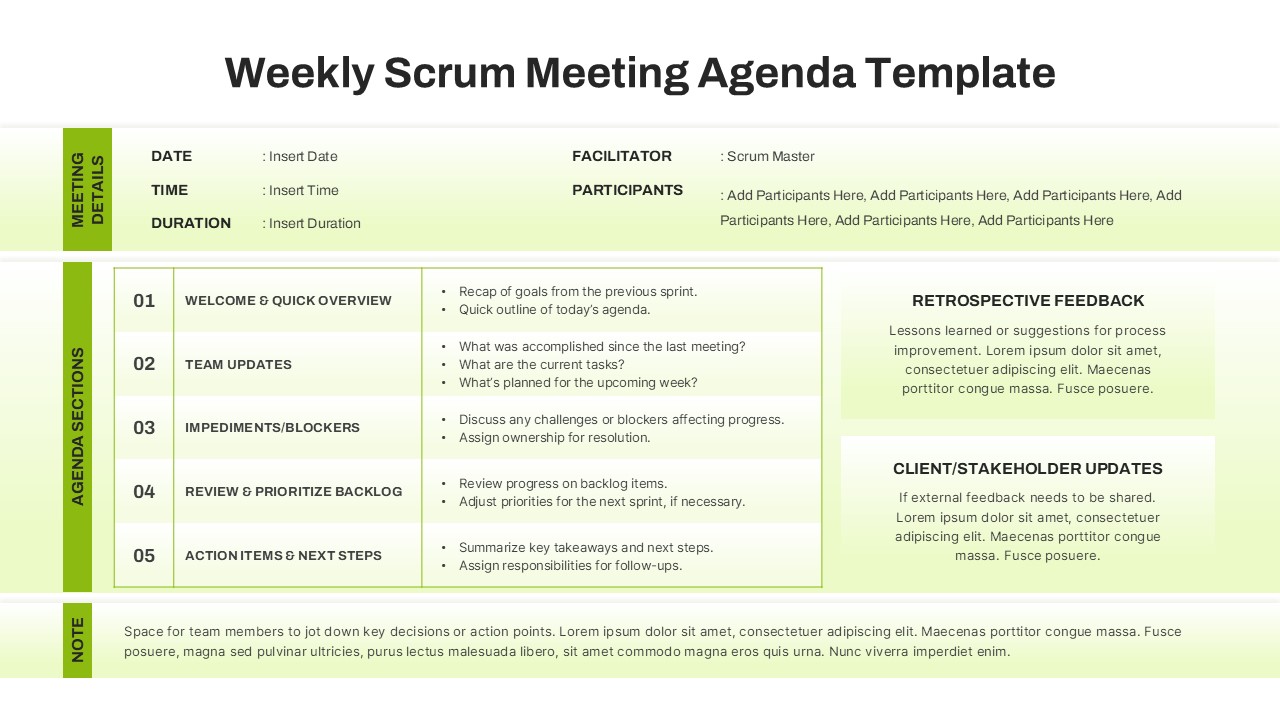
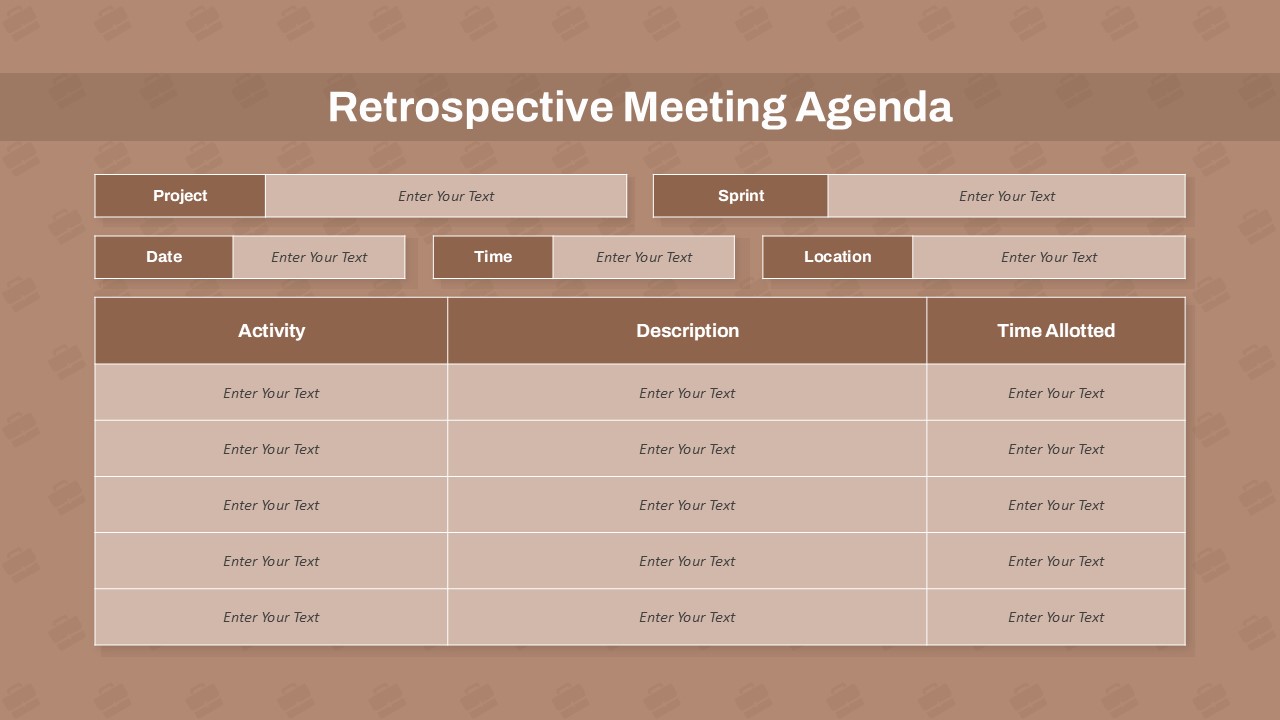
Sprint tracking, Agile stand-up meetings, Scrum reviews, Project status reports, Product development monitoring, Team performance reviews, Time estimation analysis, Workflow optimization, Stakeholder updates, Iteration planning sessions
FAQs
You May Also Like These Presentation Templates


- Free
- Free


- Free

- Free
- Free
- Free