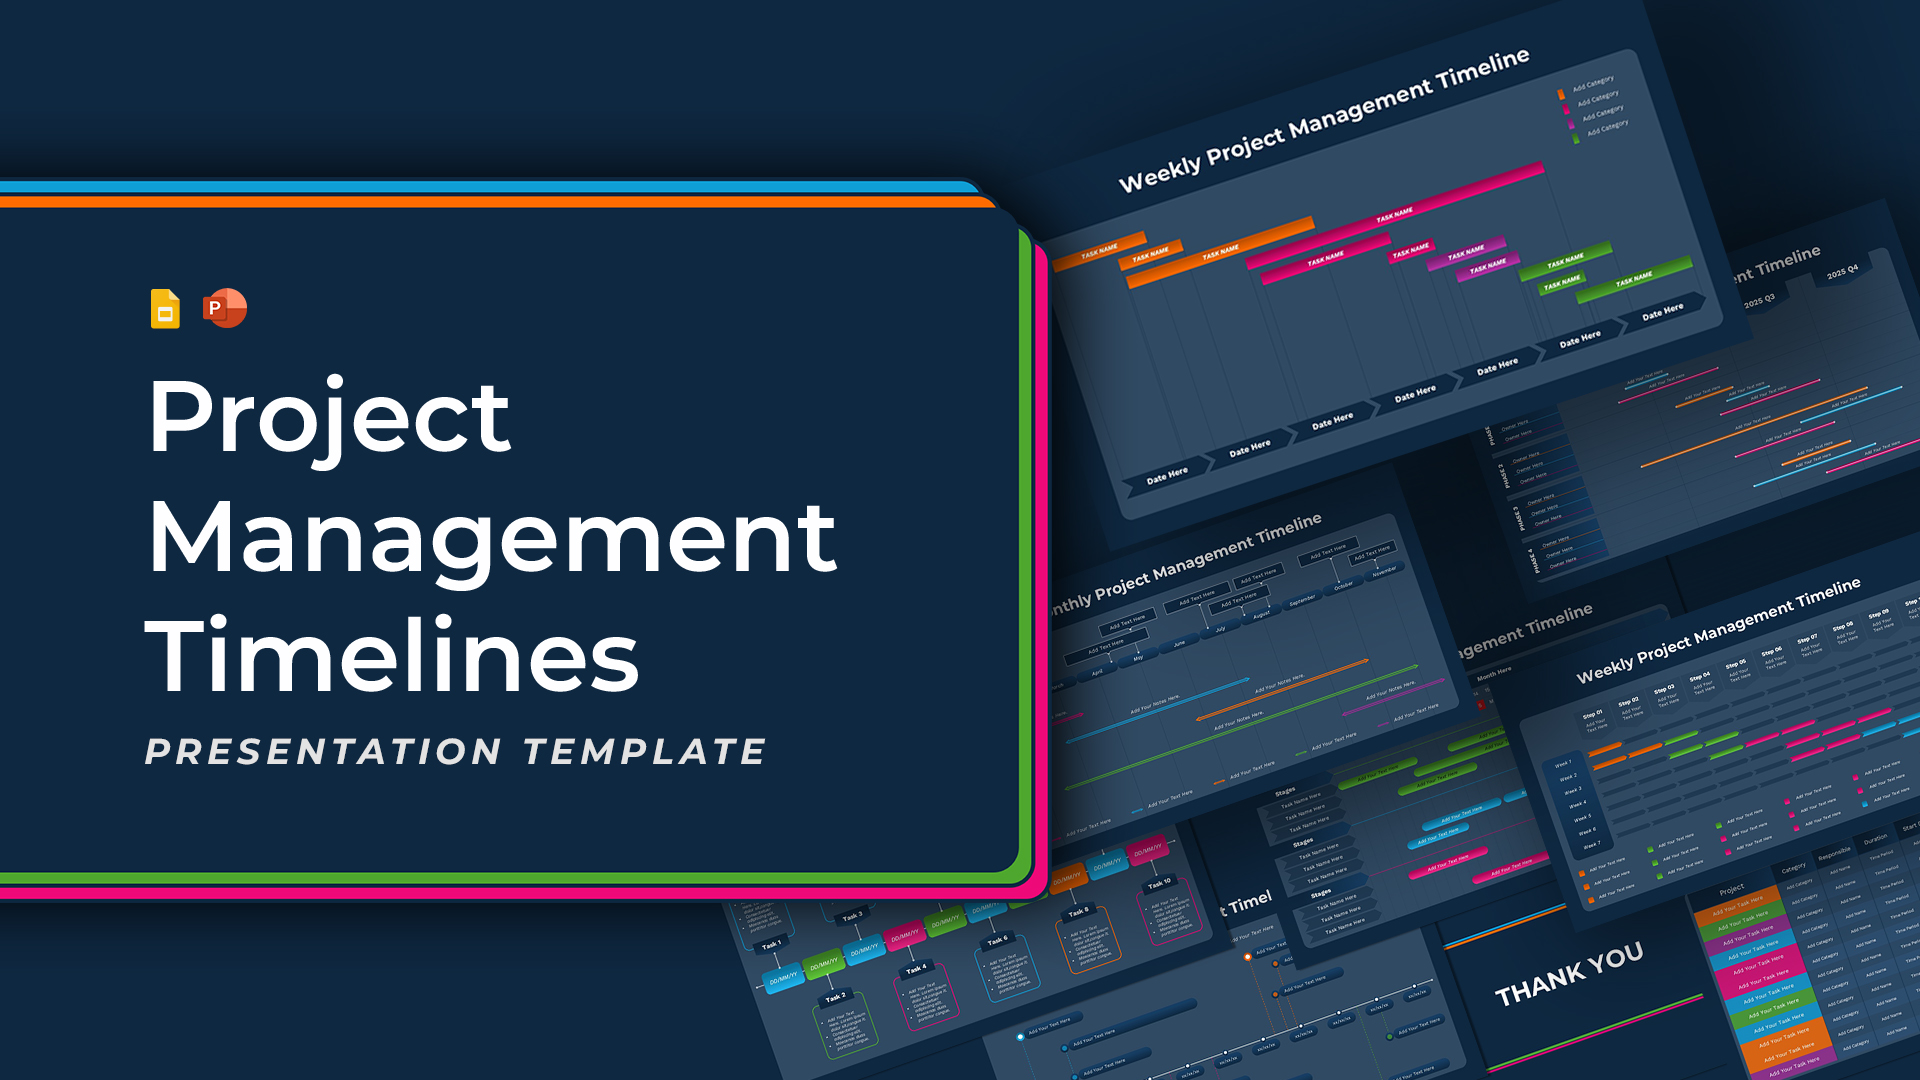
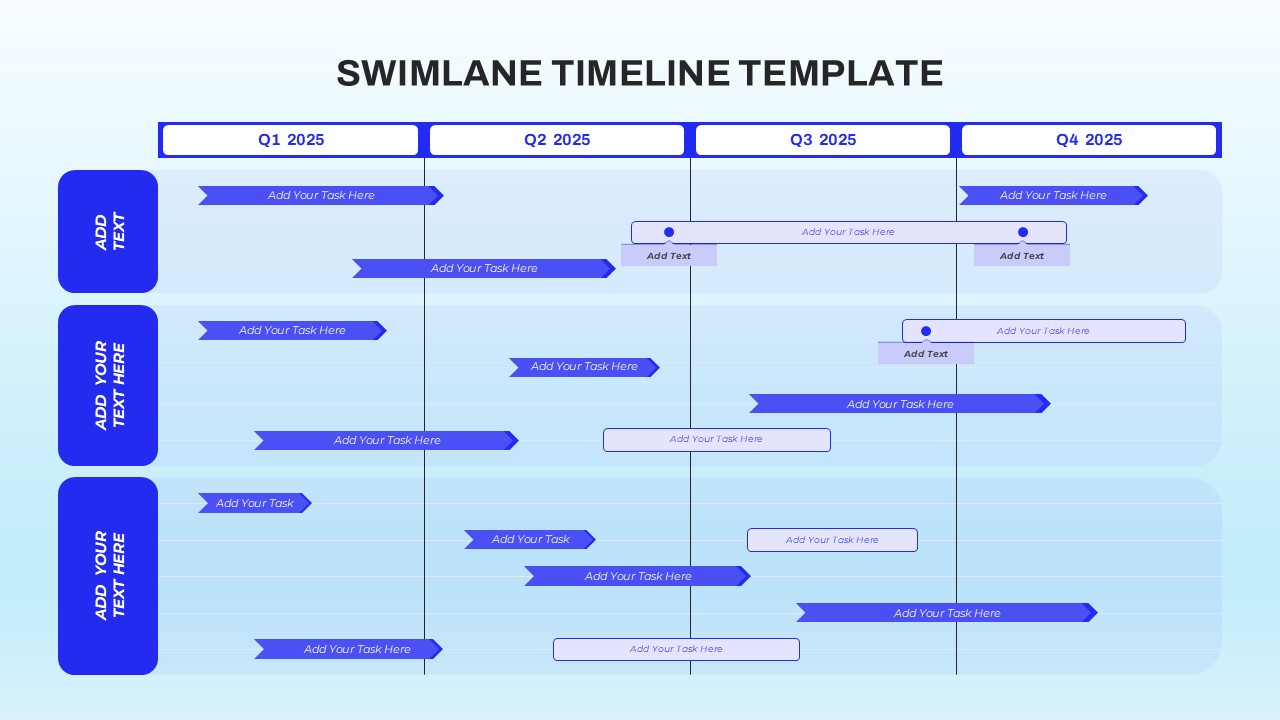
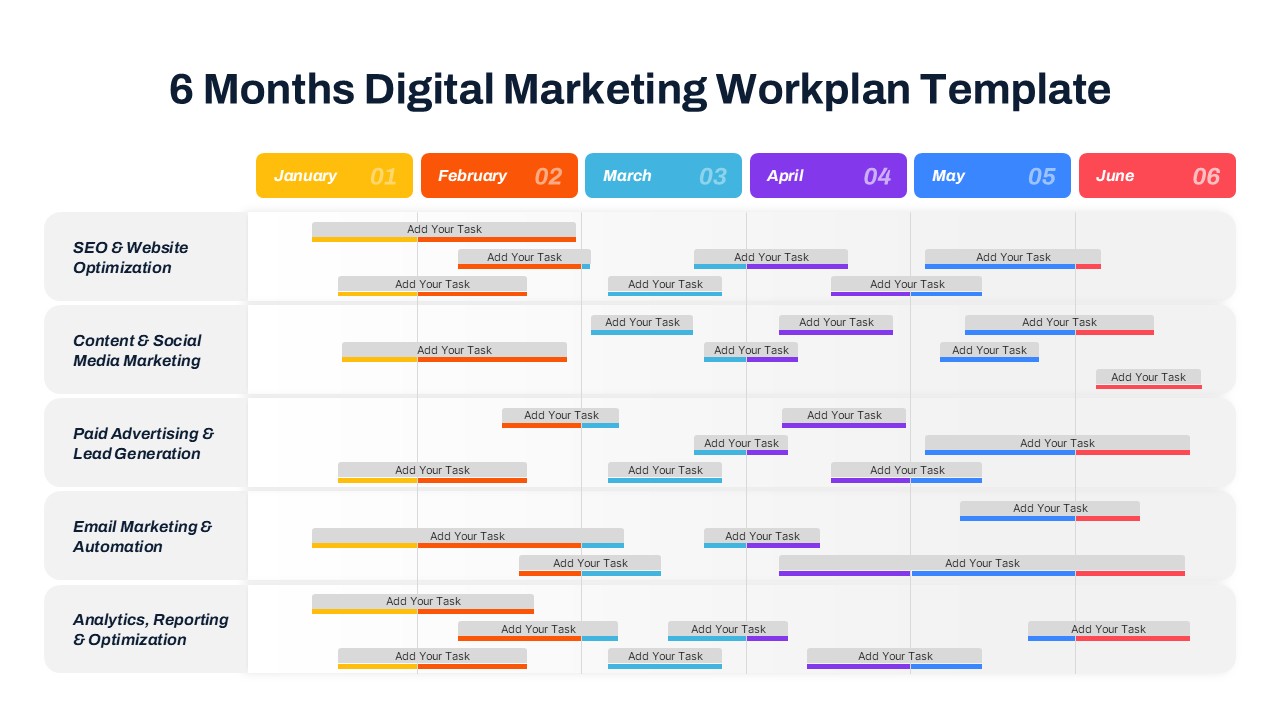
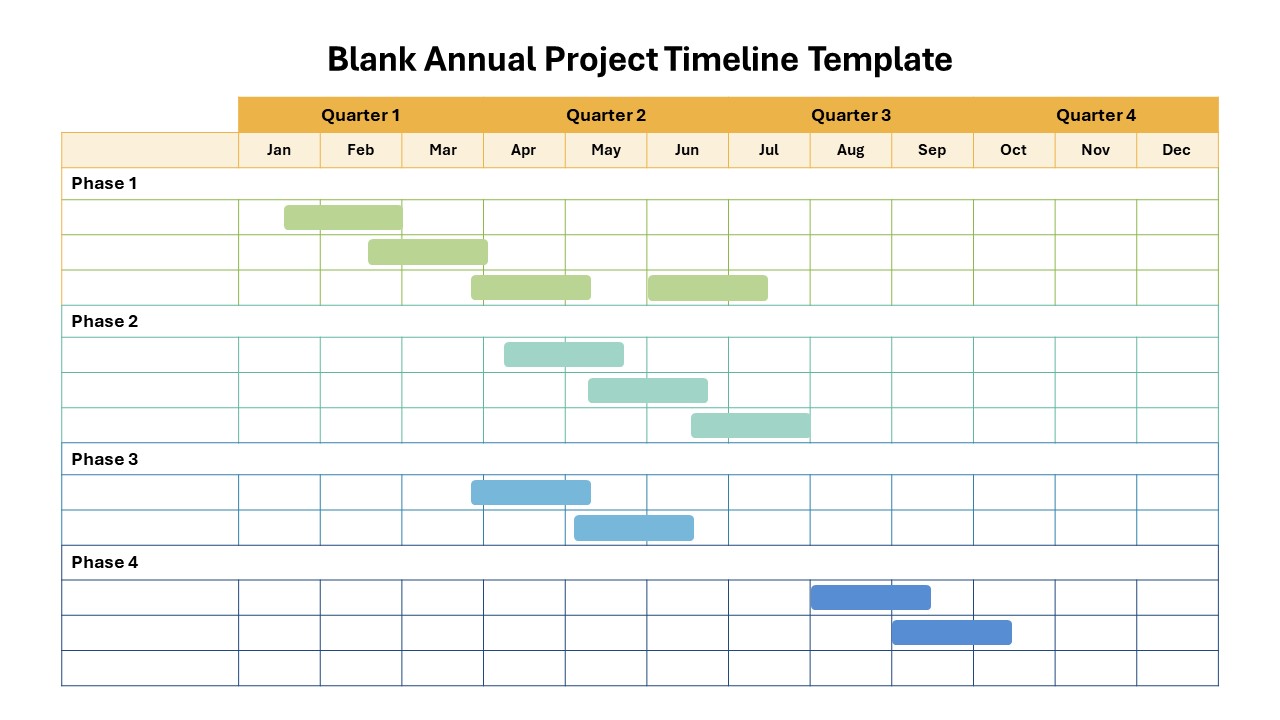
Simple Gantt Chart Template for PowerPoint and Google Slides
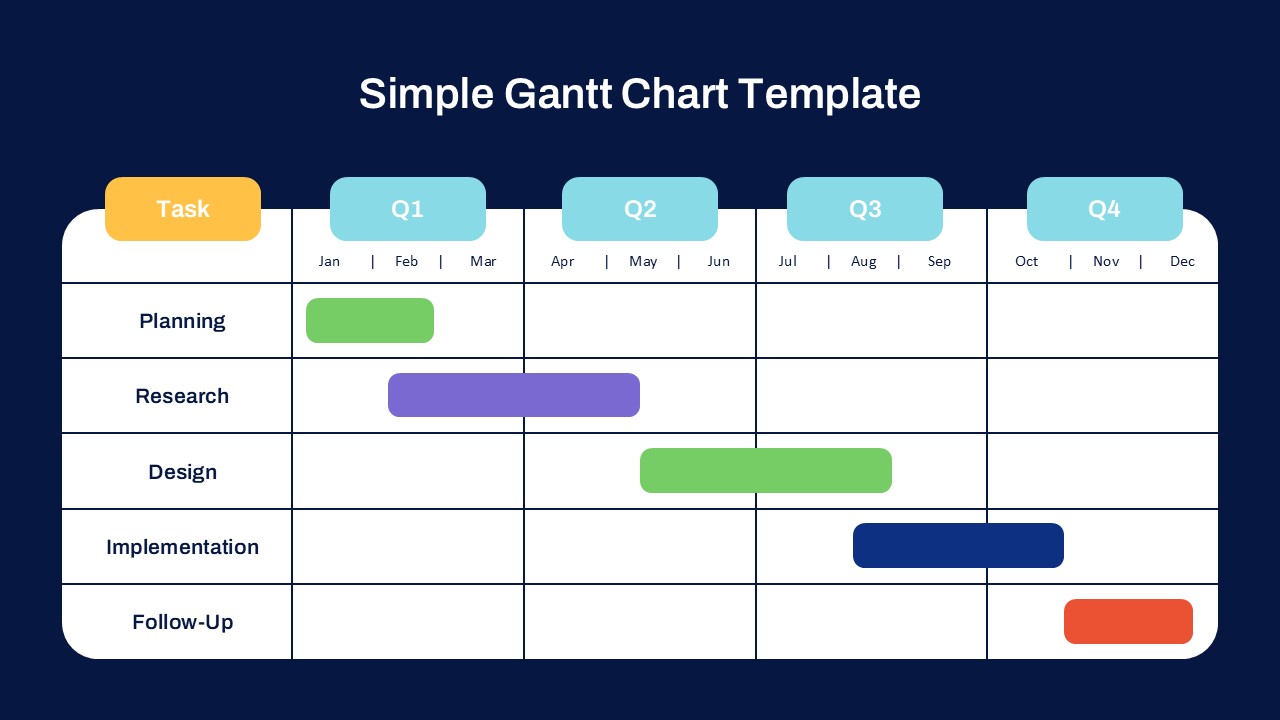
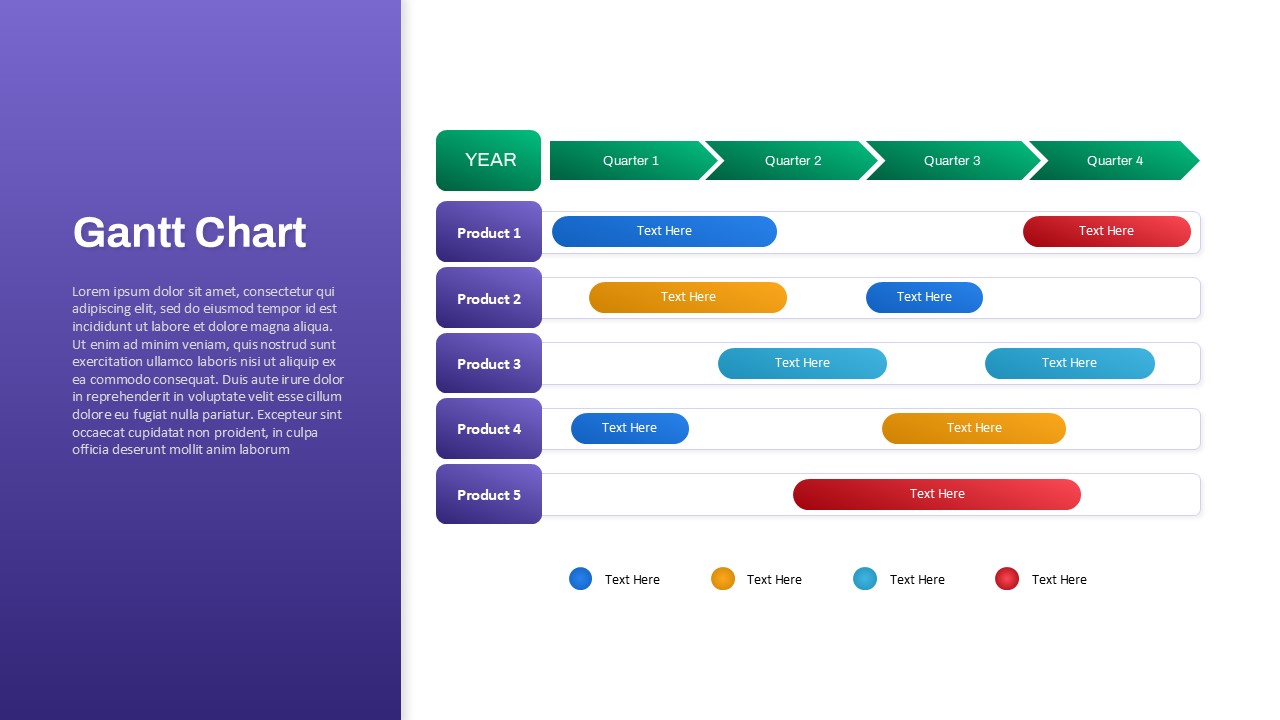
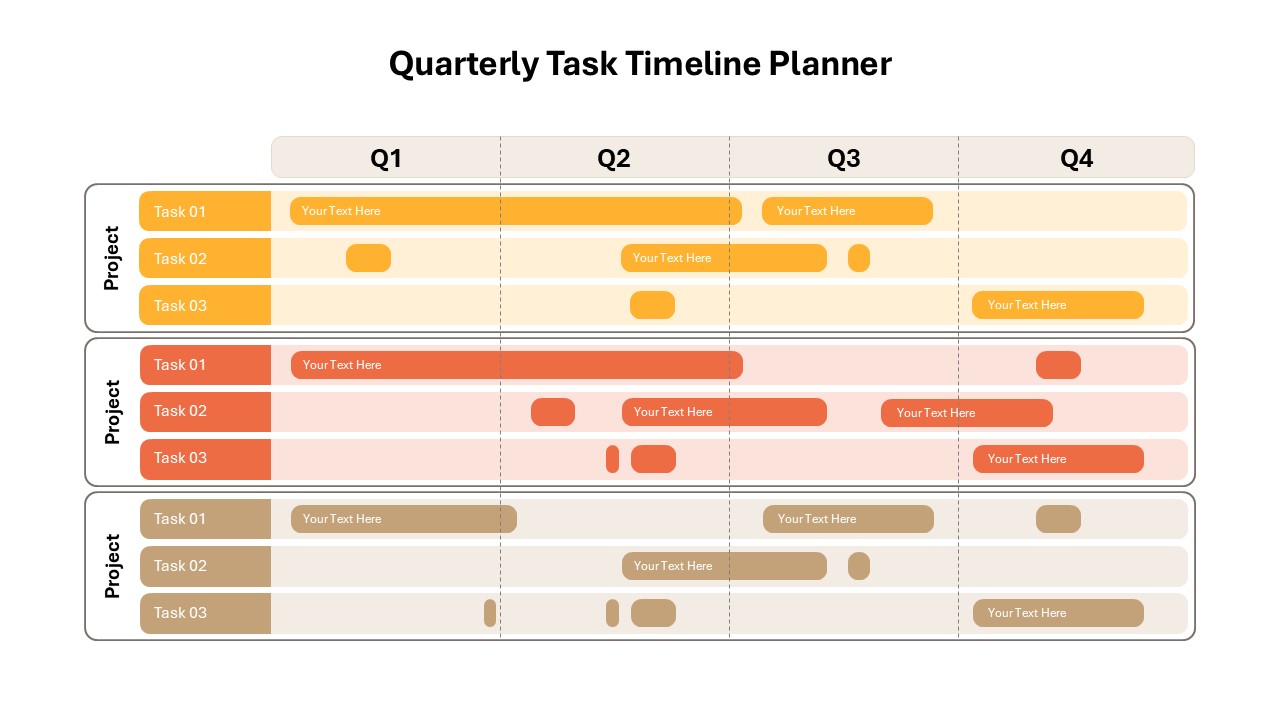
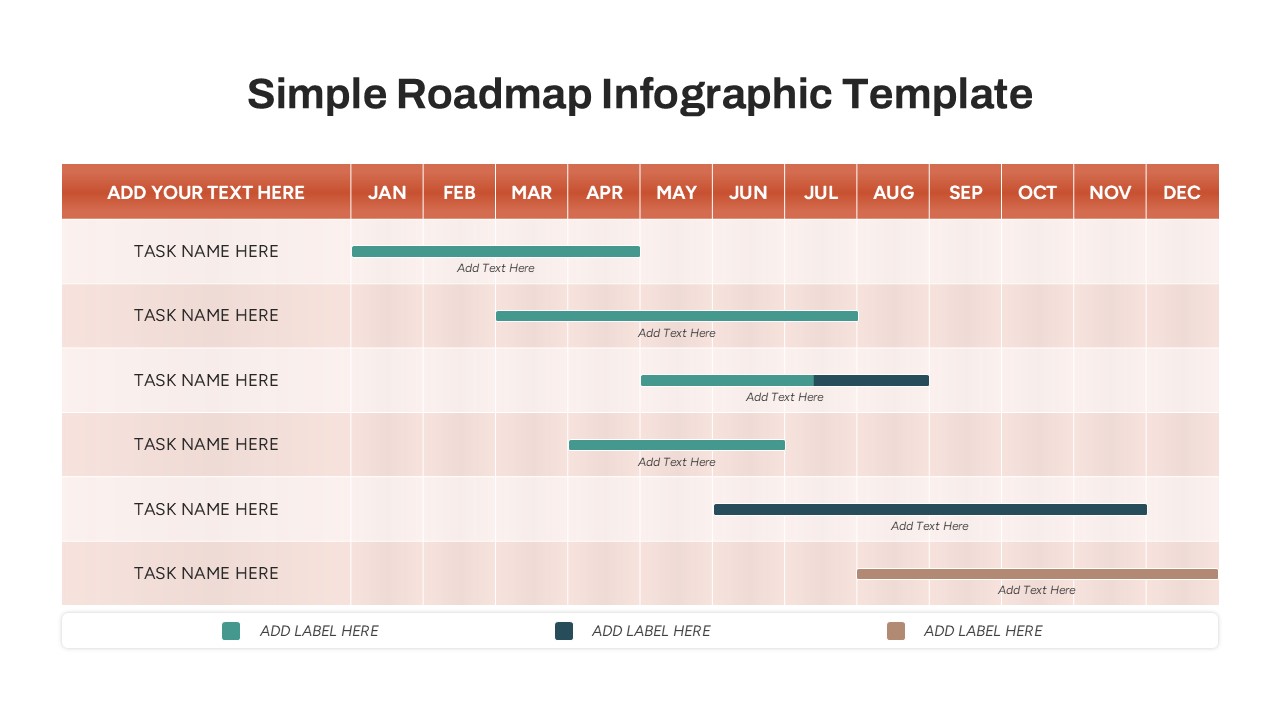
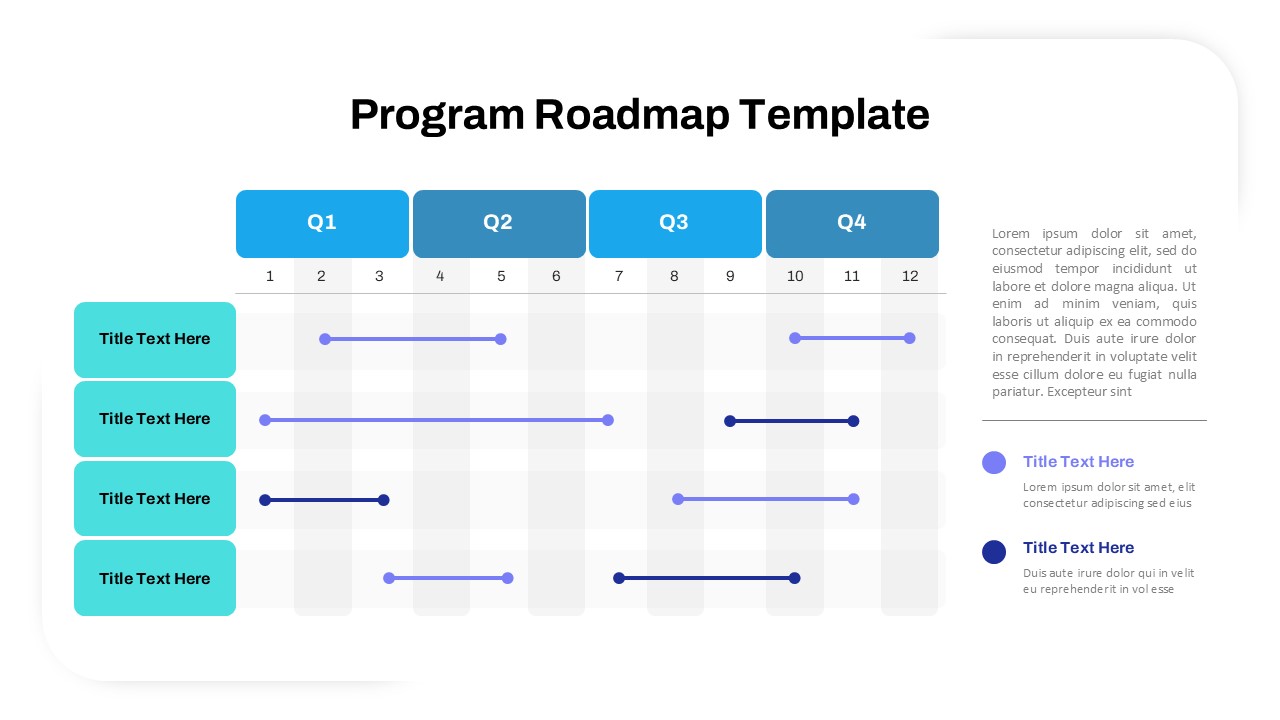
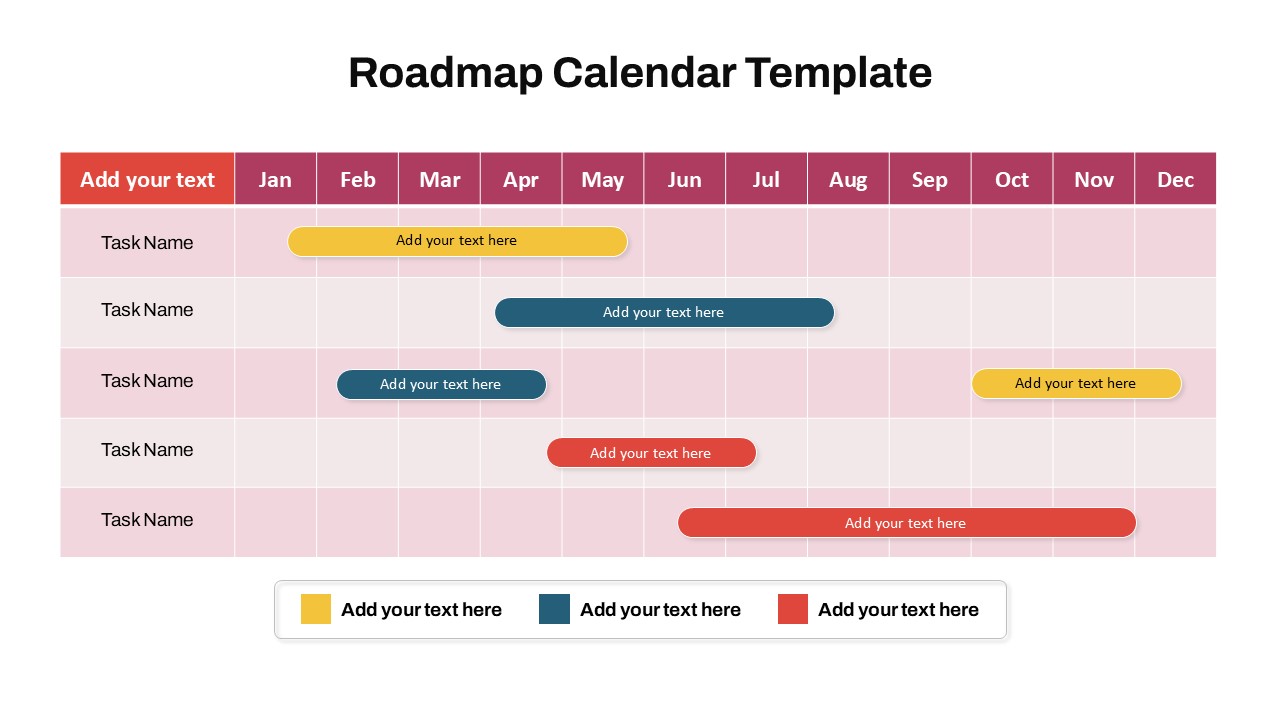
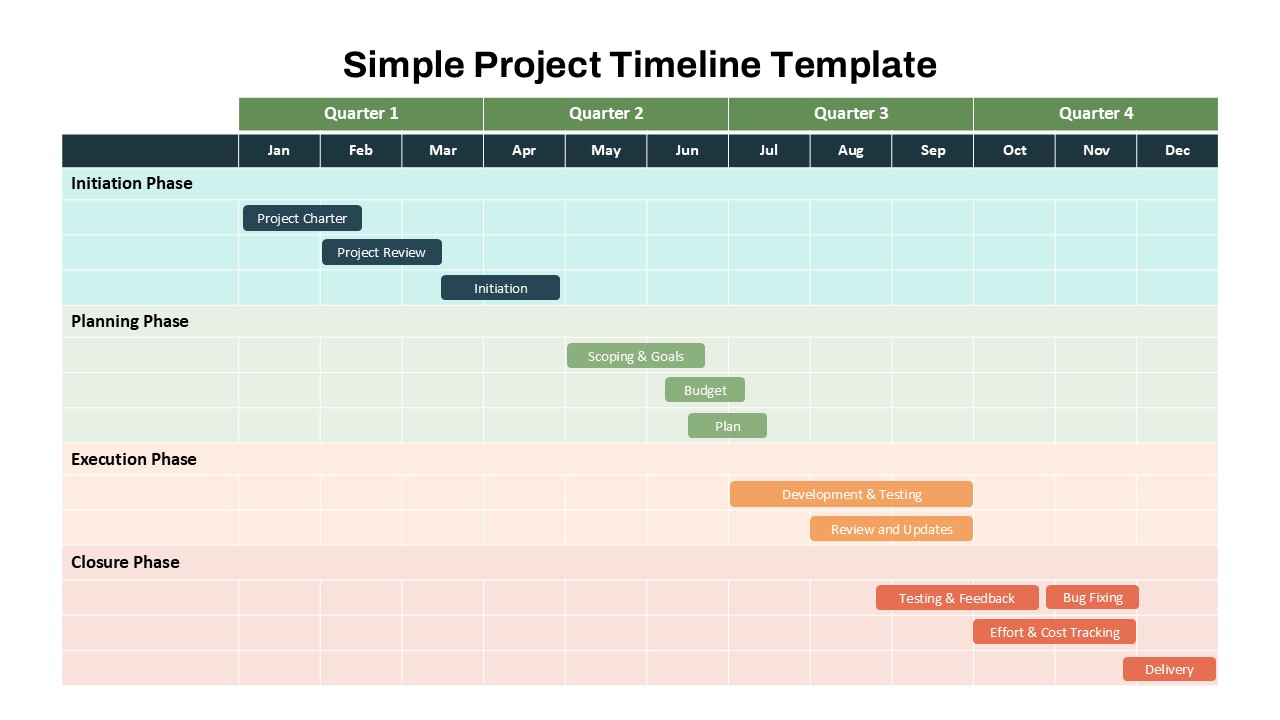
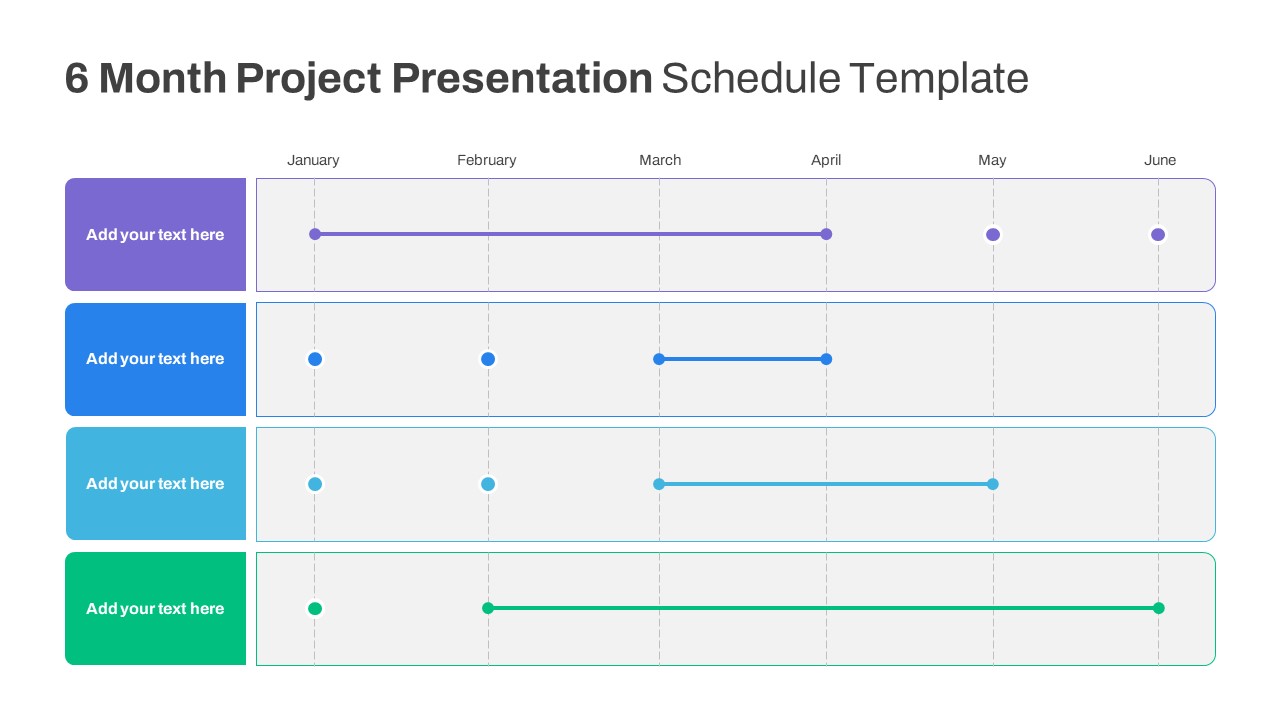
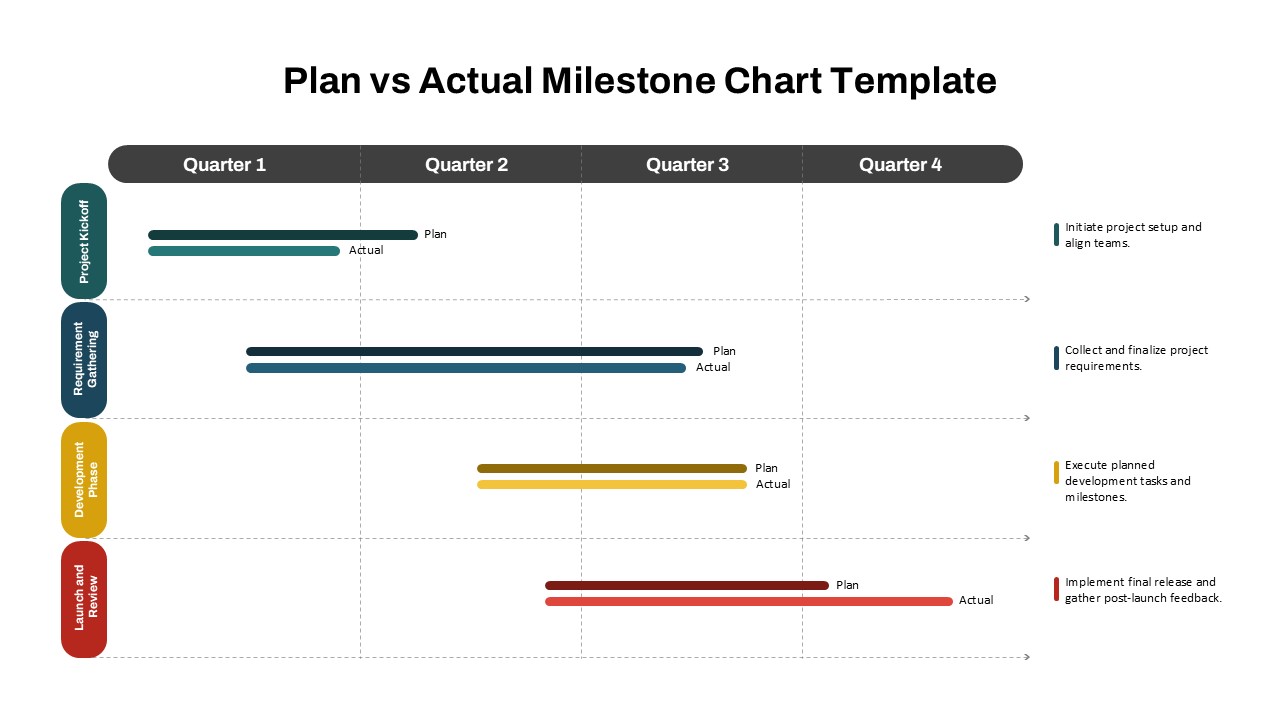
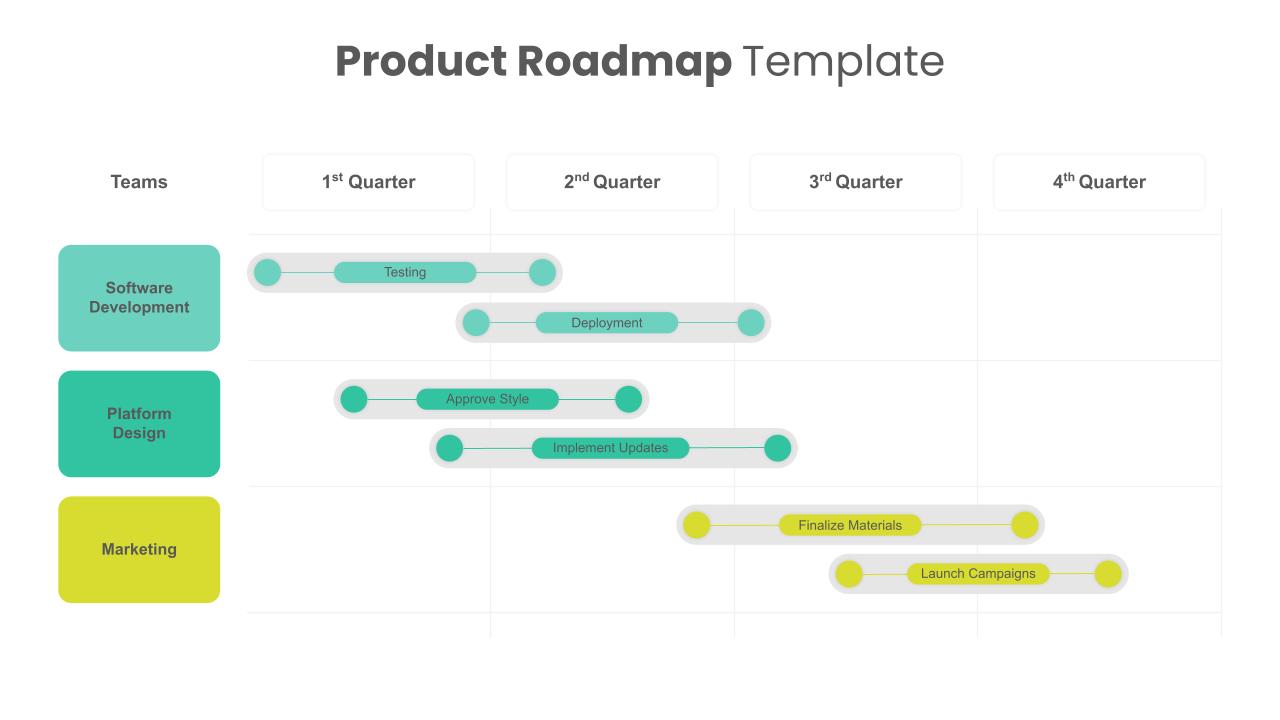
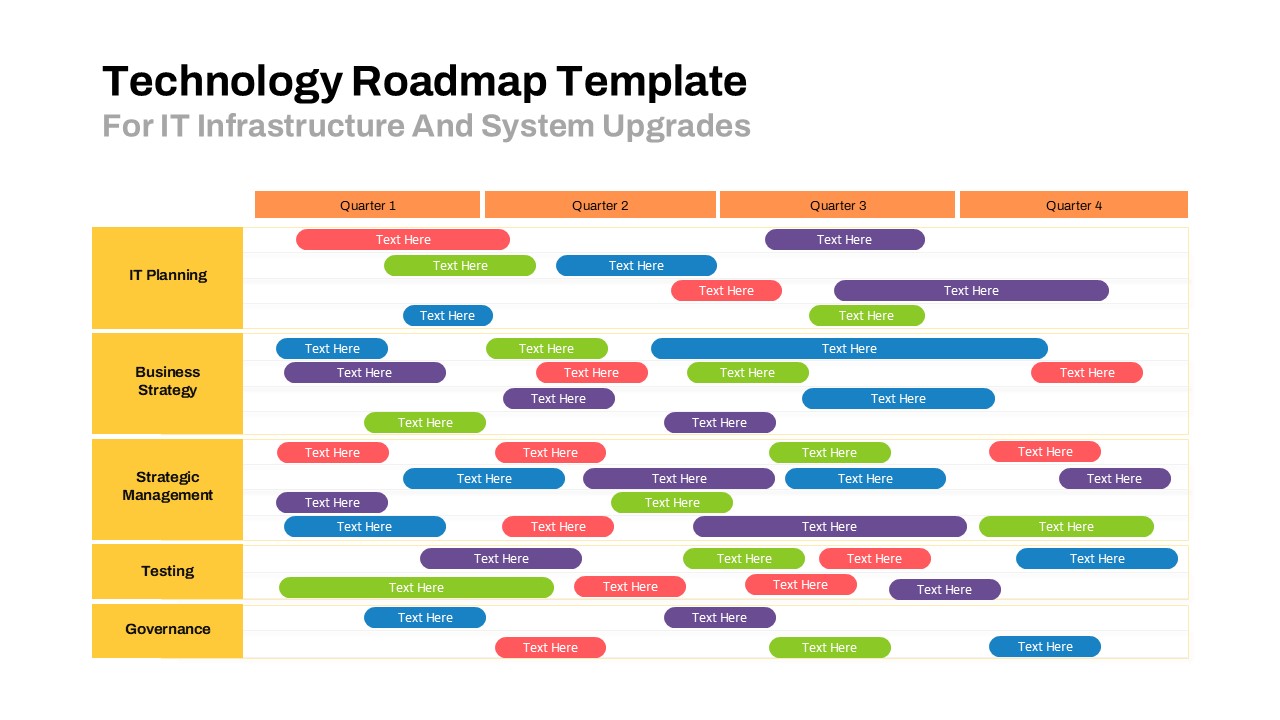
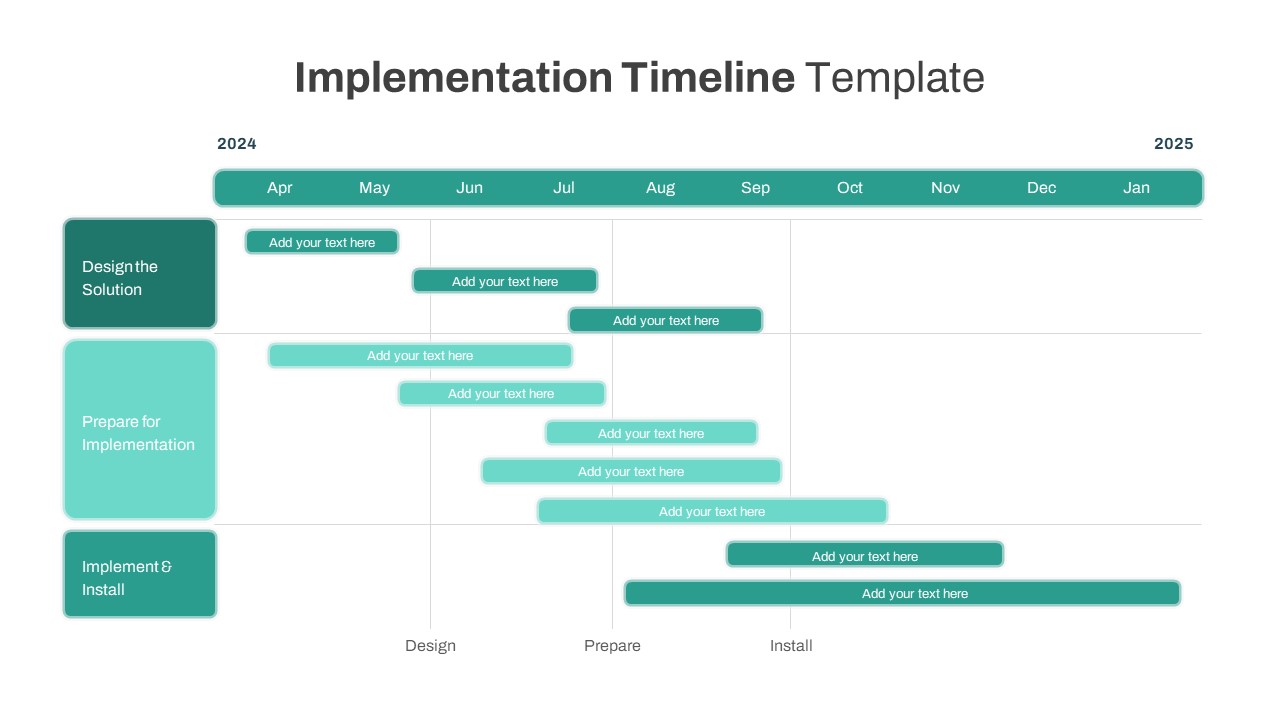
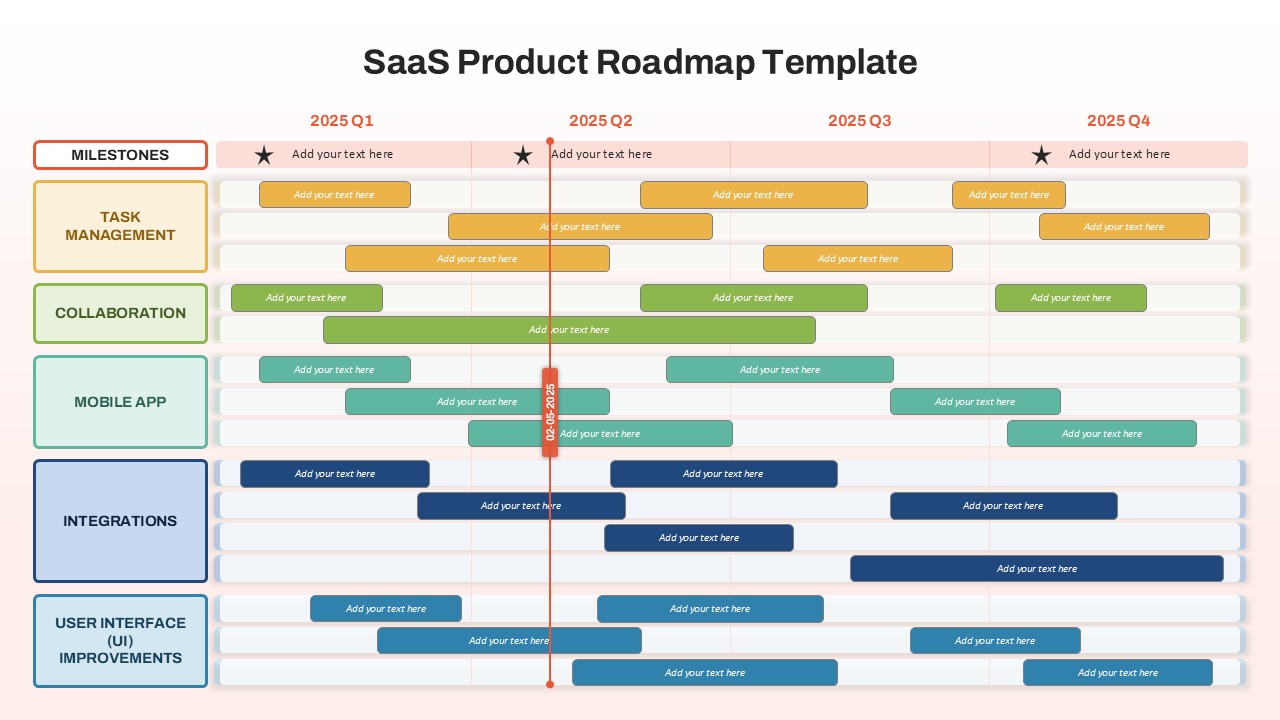
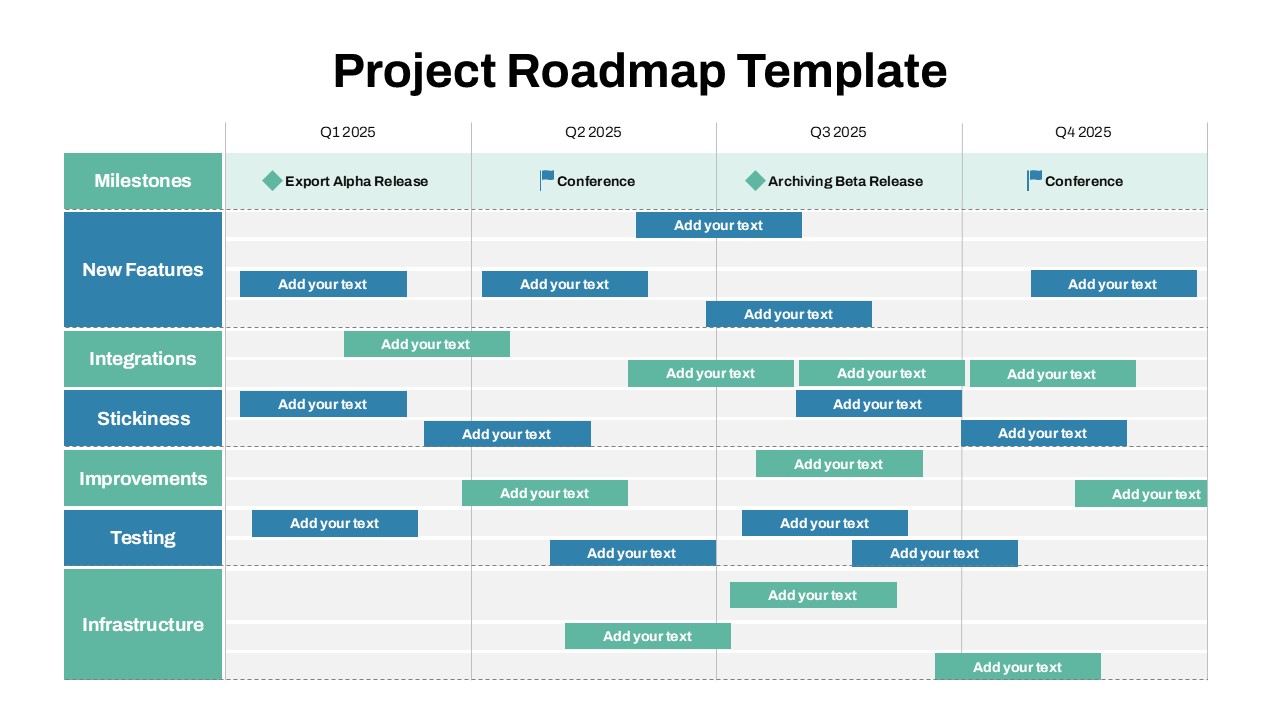
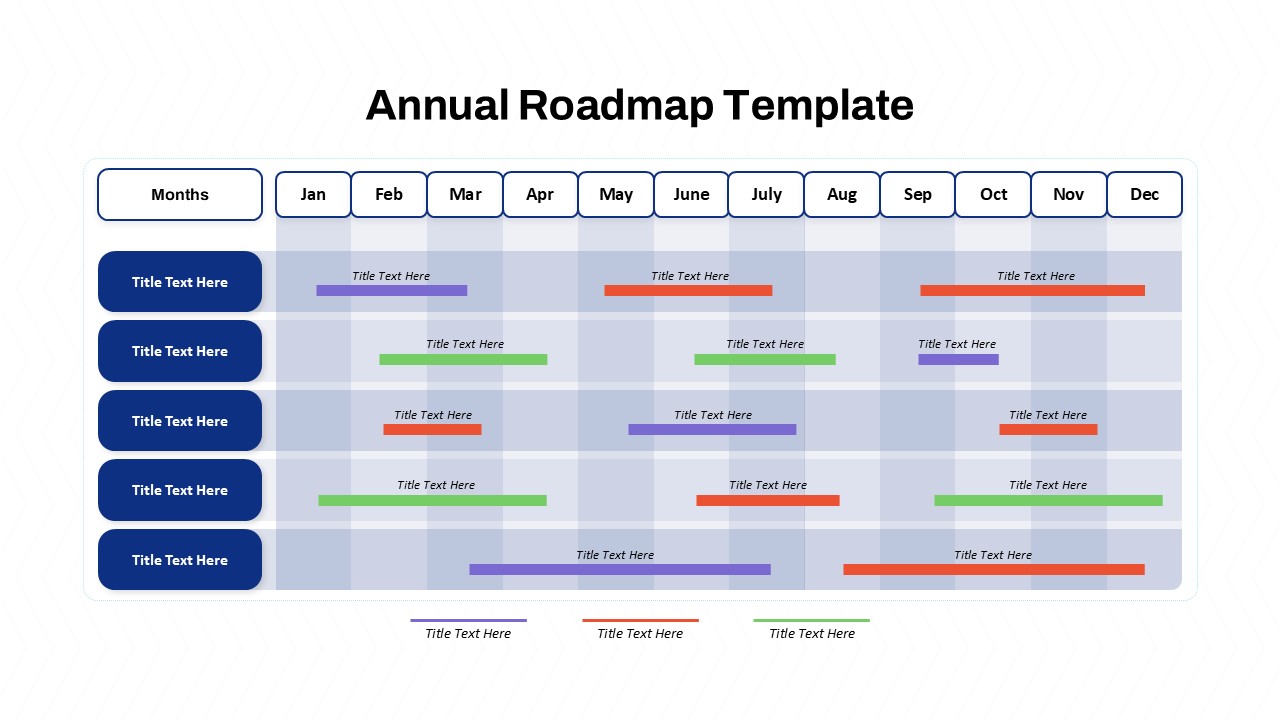
The simple gantt chart for powerpoint and google slides offers a clean and visually engaging way to map out project timelines across all four quarters of the year. Ideal for project managers, team leaders, and planners, this gantt chart on powerpoint visually organizes tasks into a quarterly timeline, enabling efficient tracking and coordination of activities from start to finish.
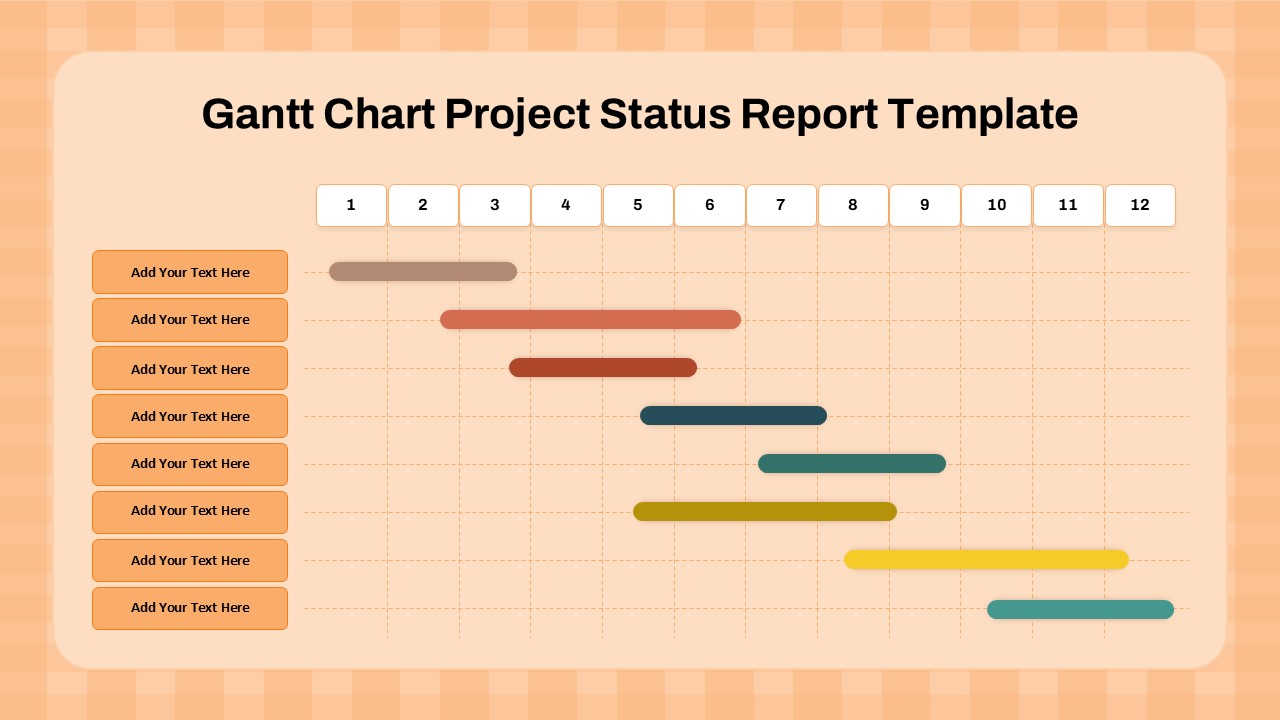
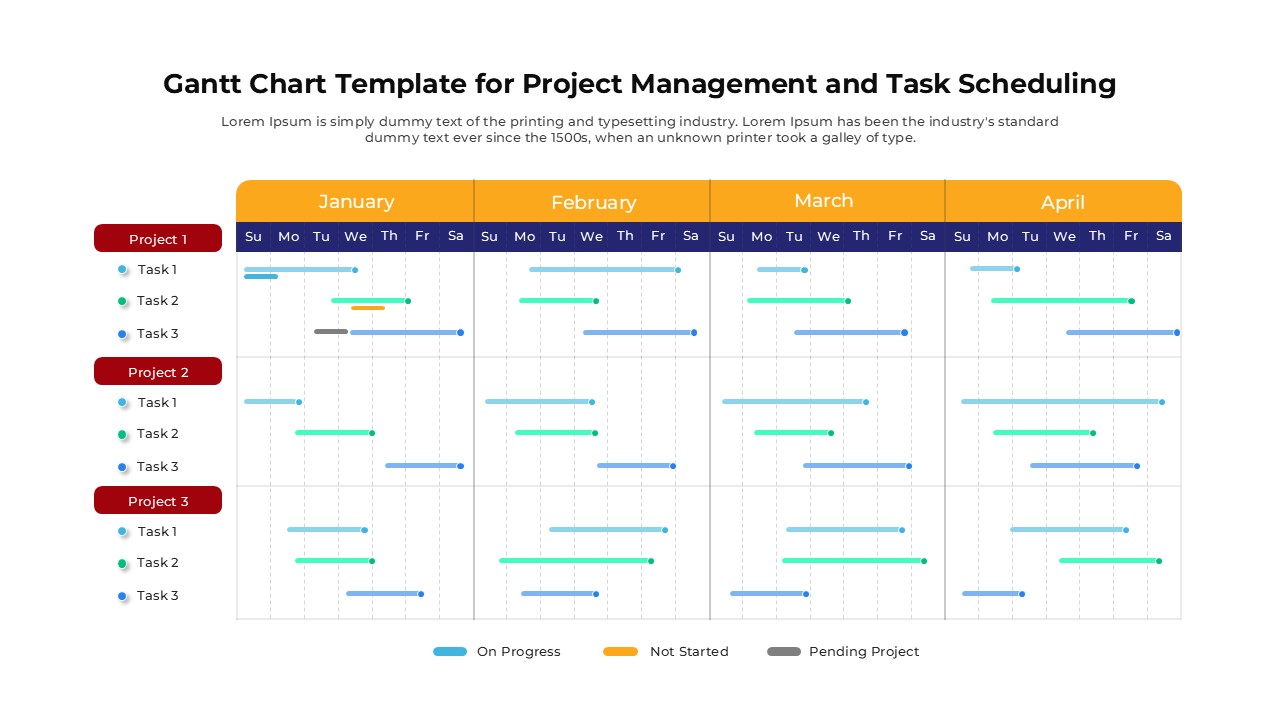
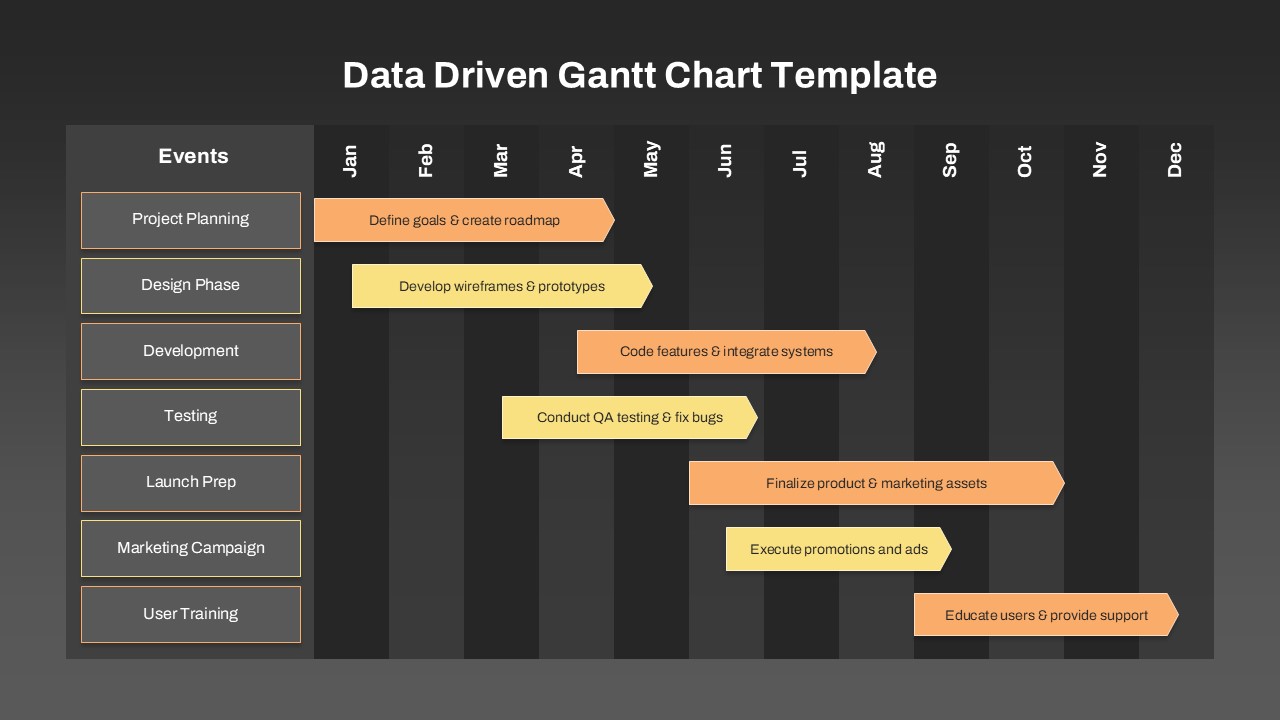
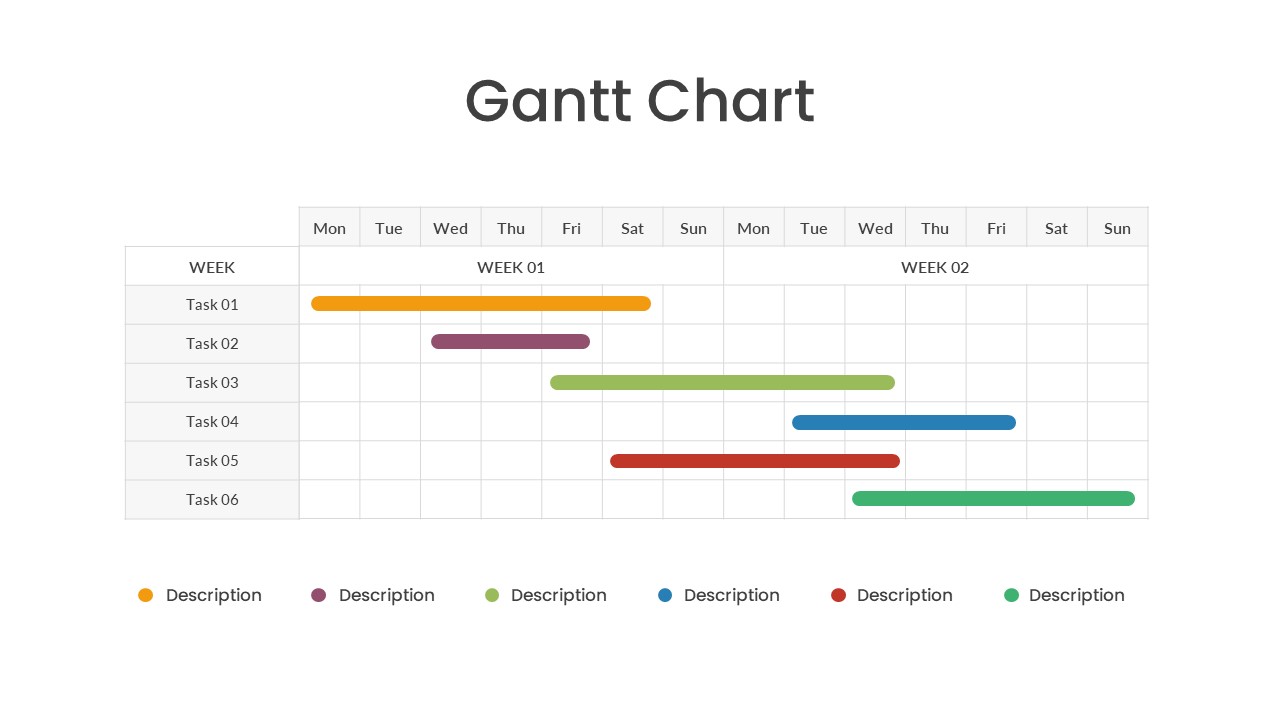
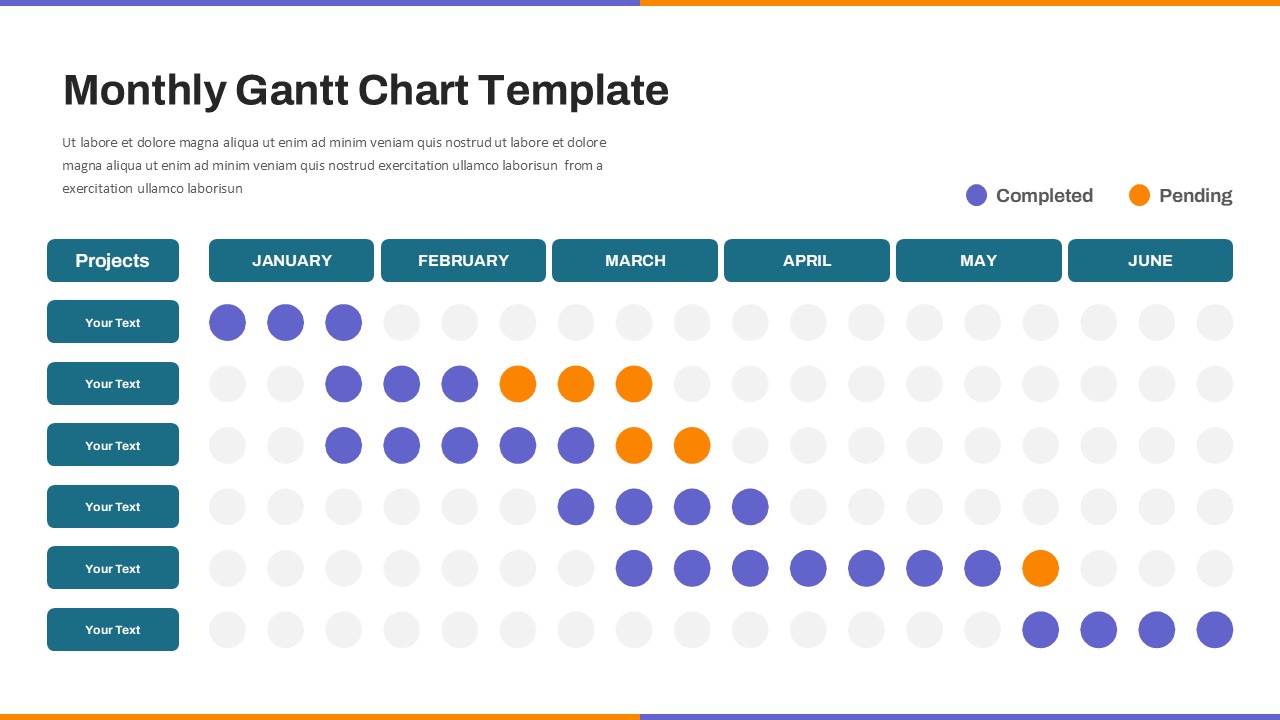
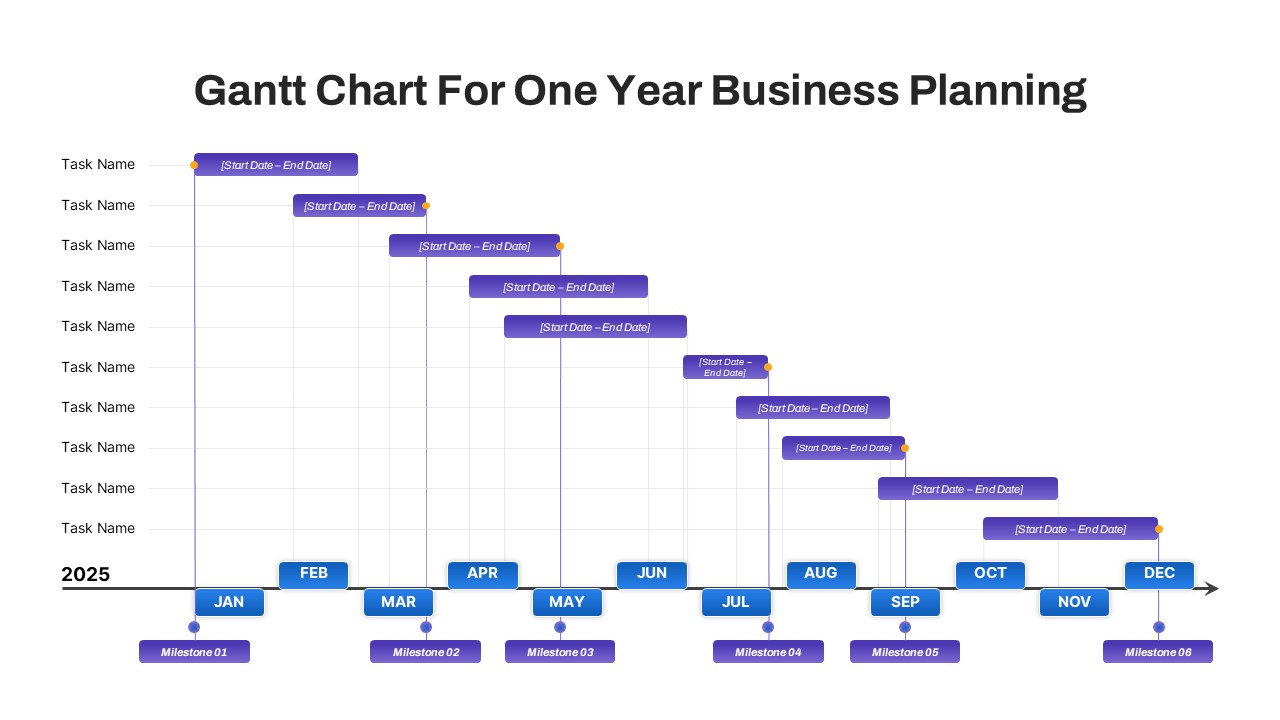
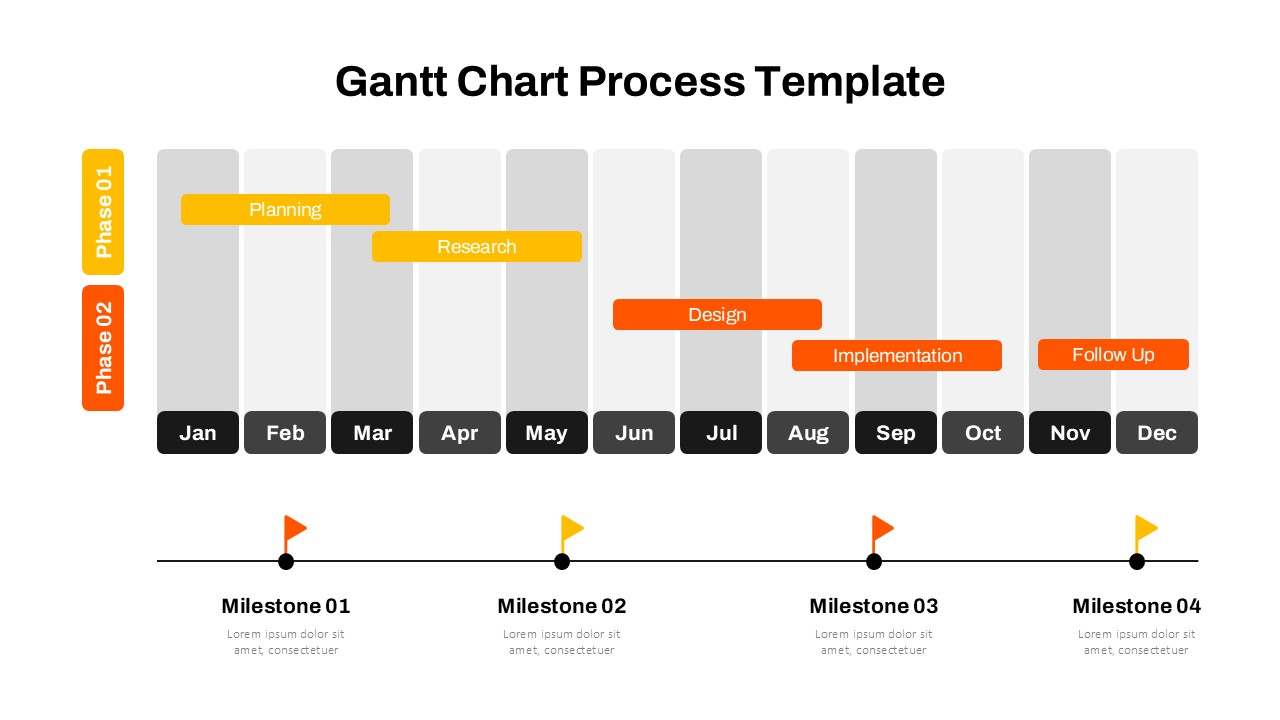
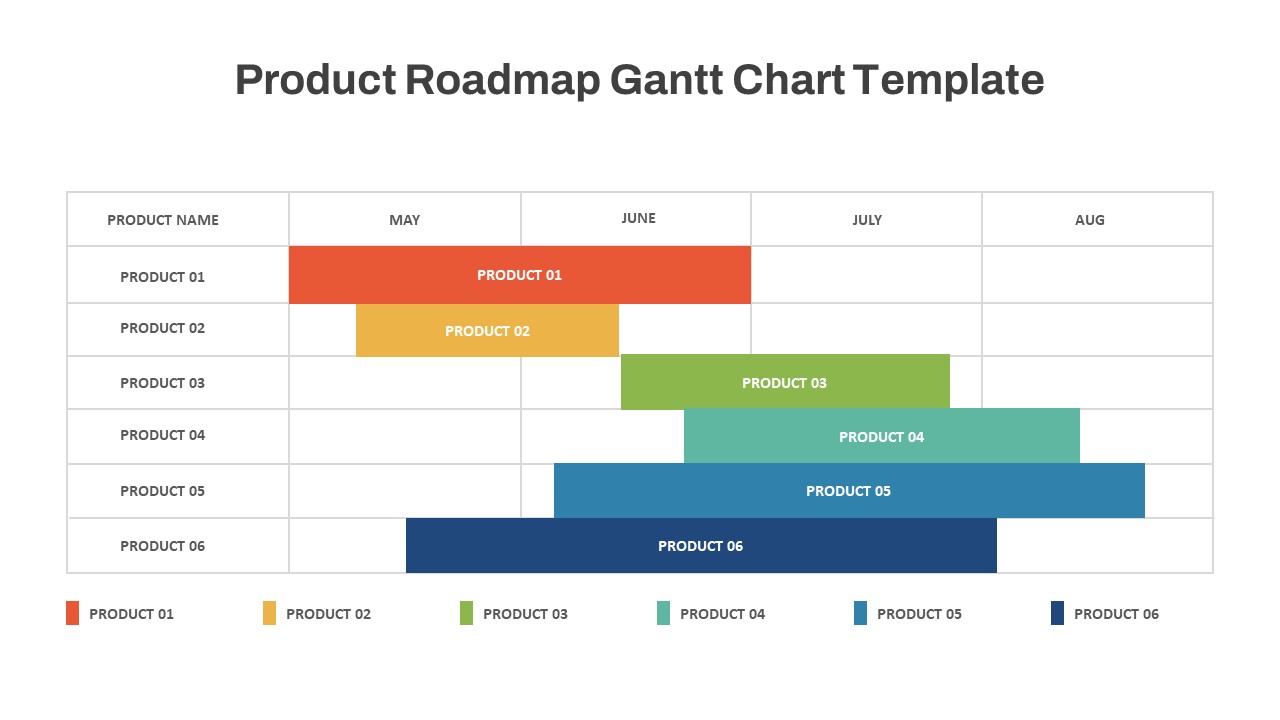
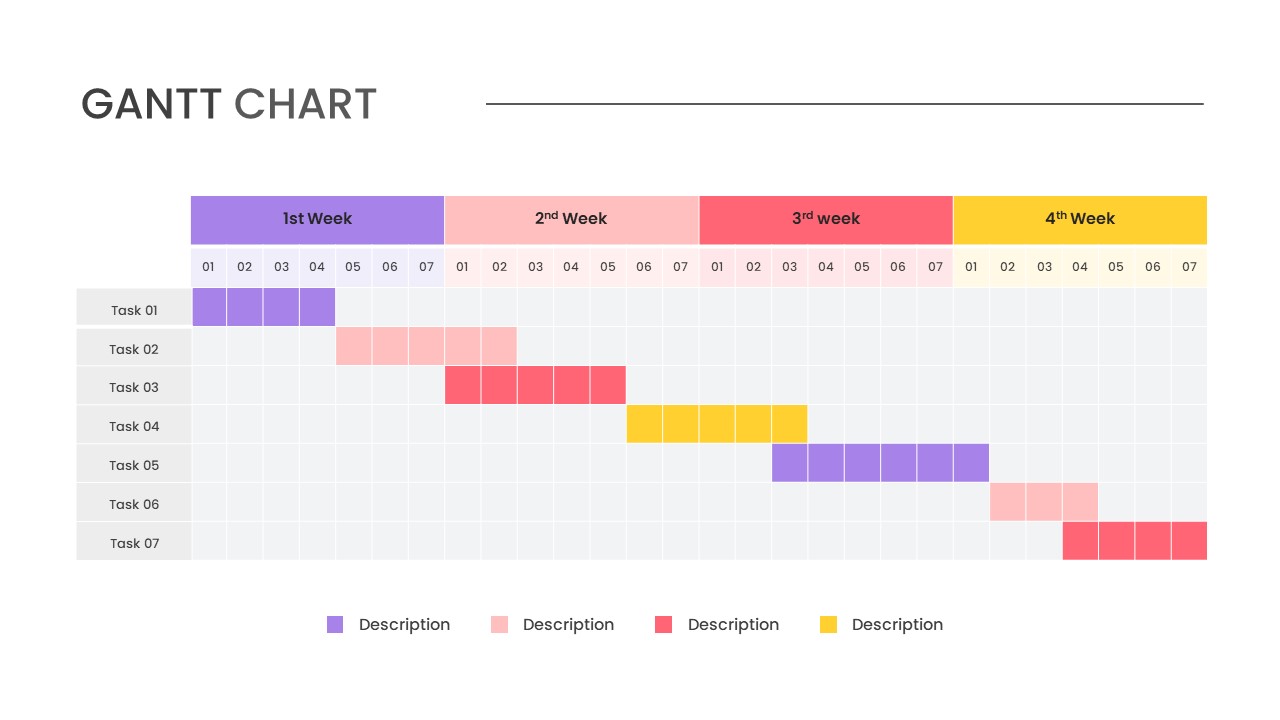
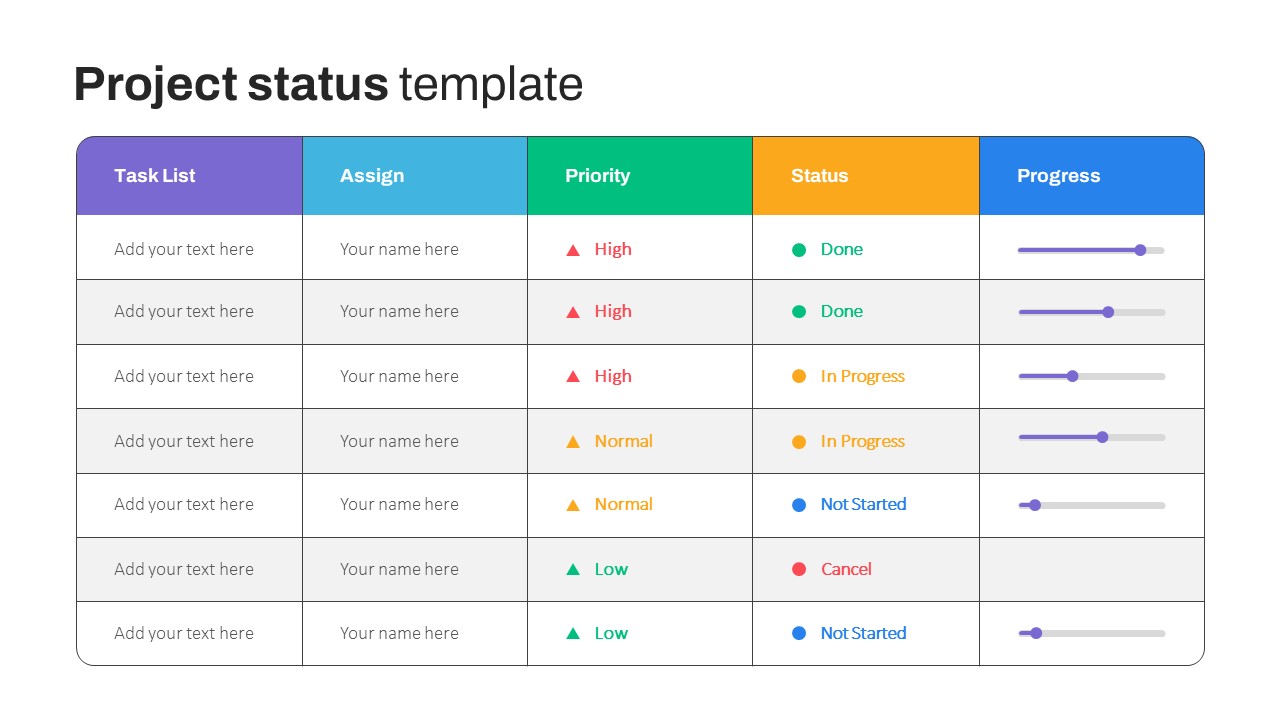
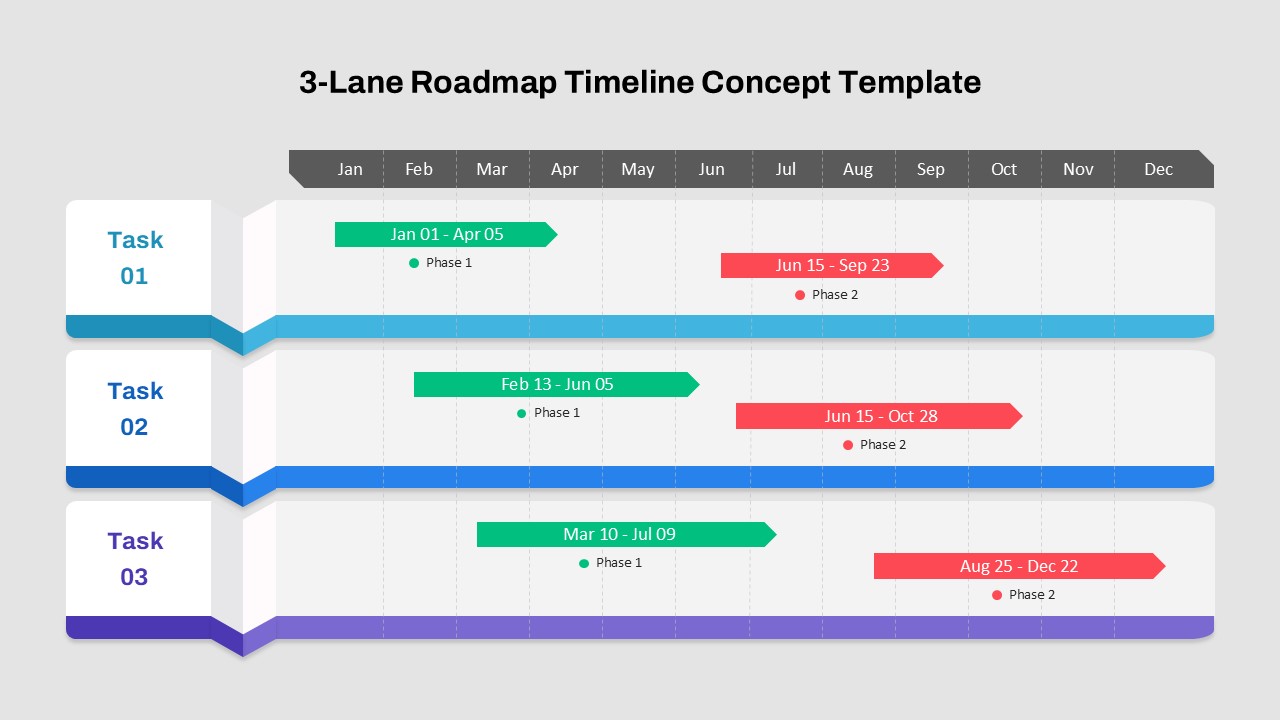
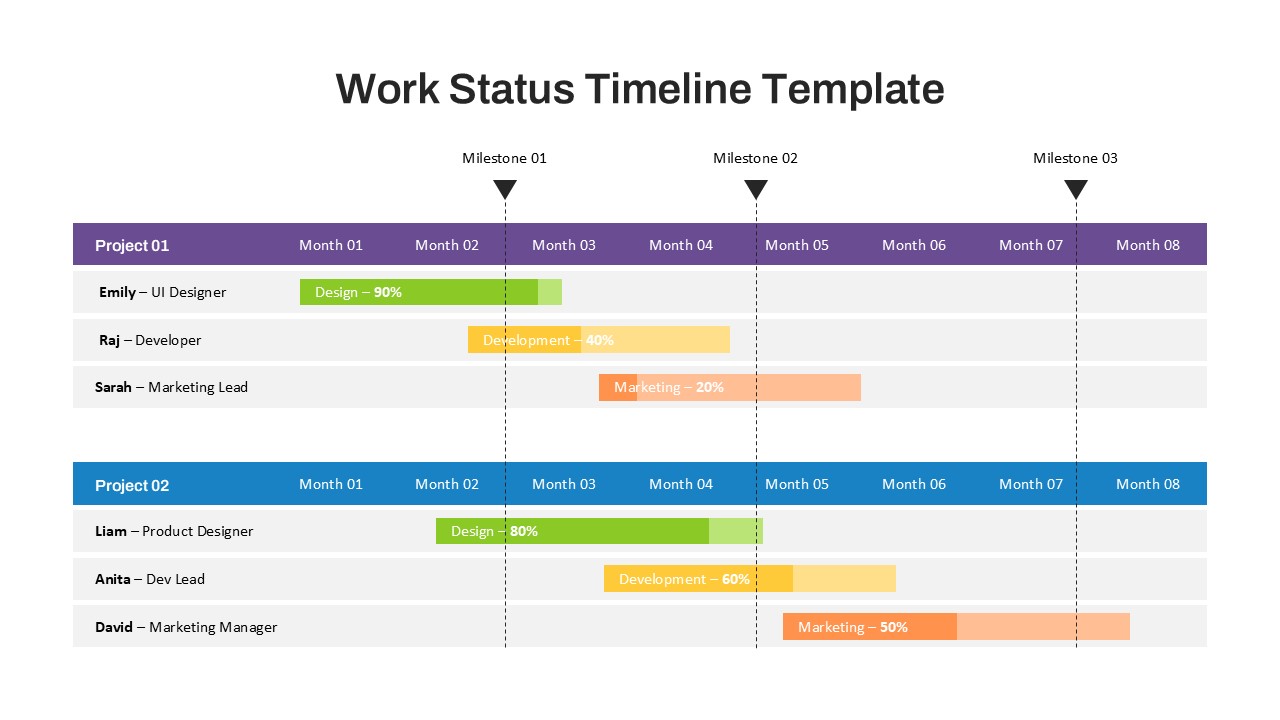
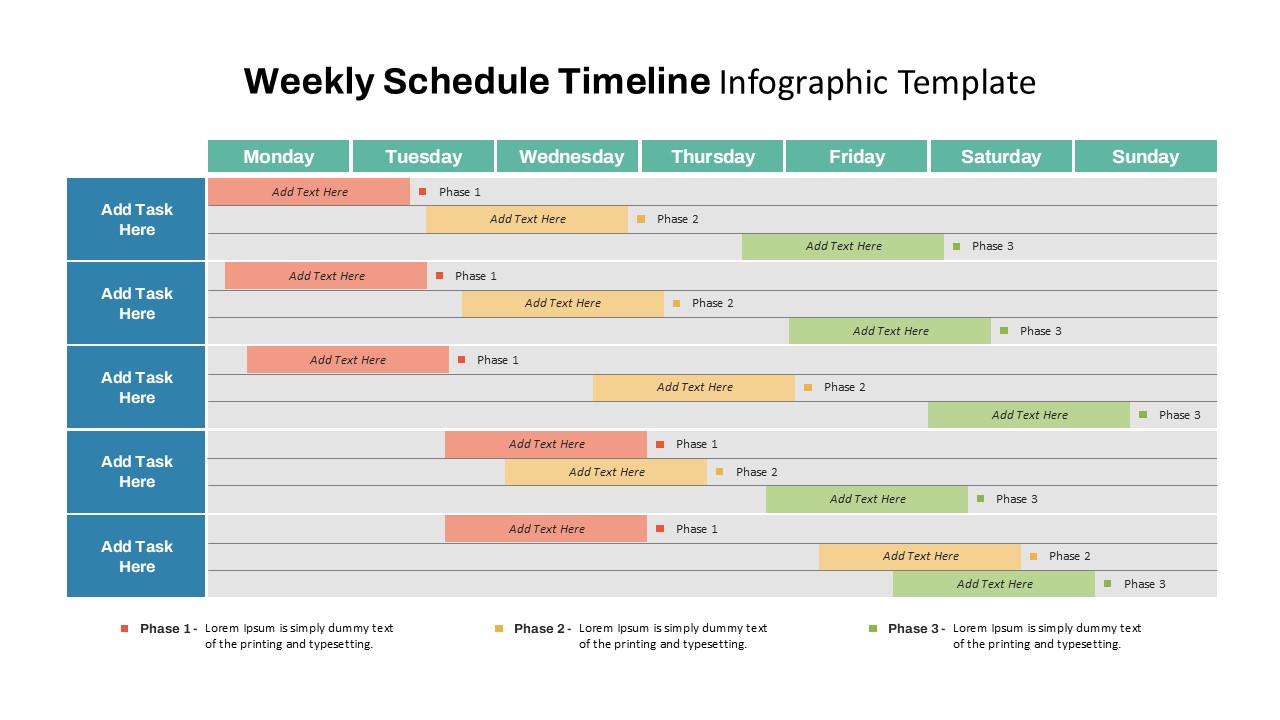
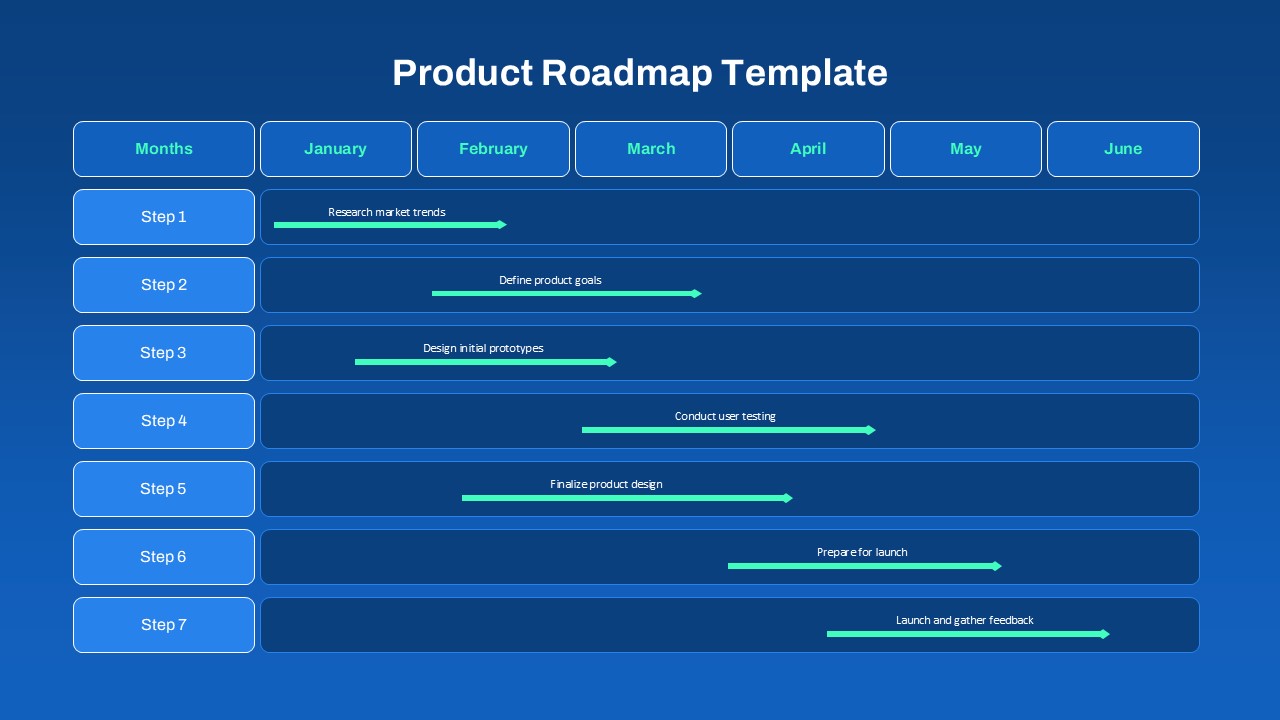
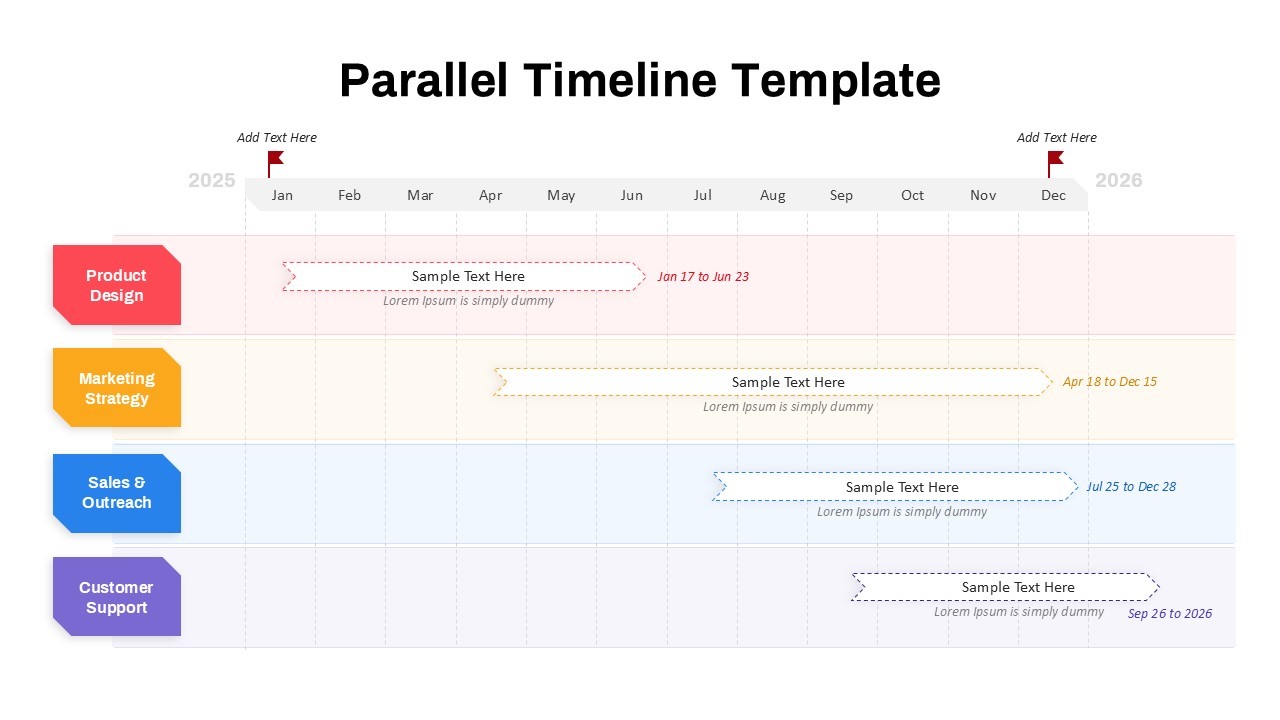
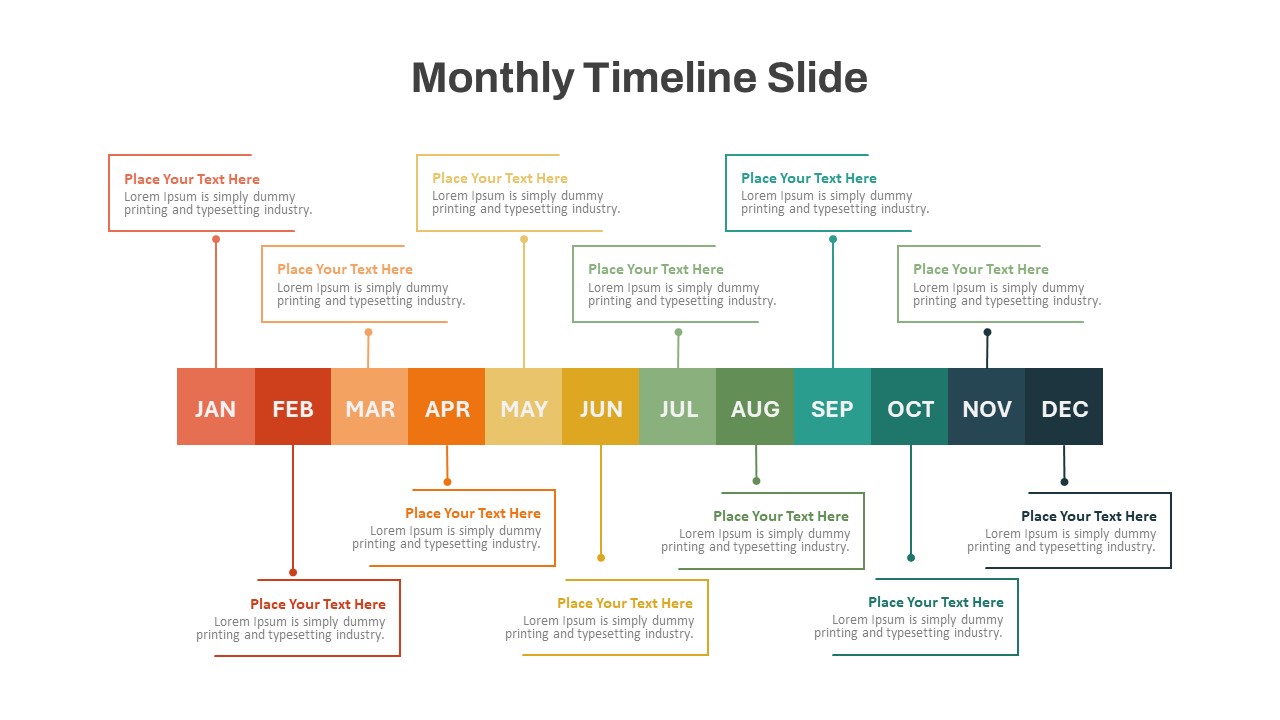
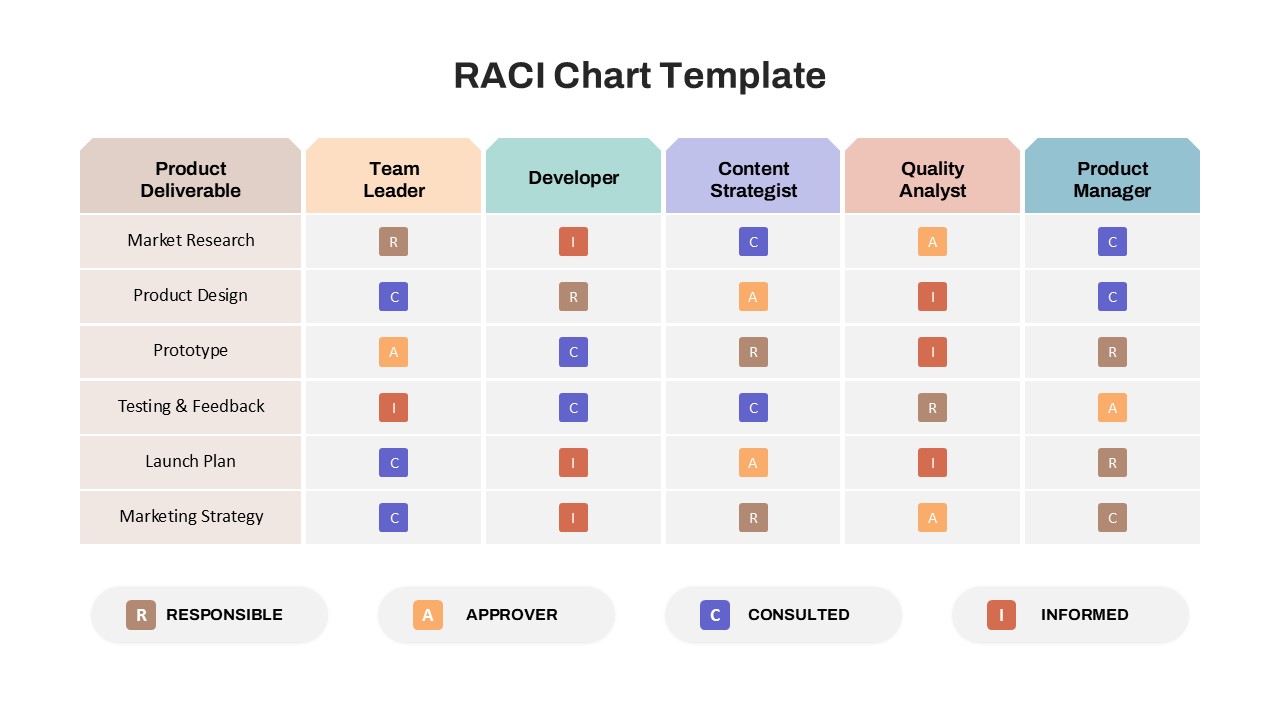
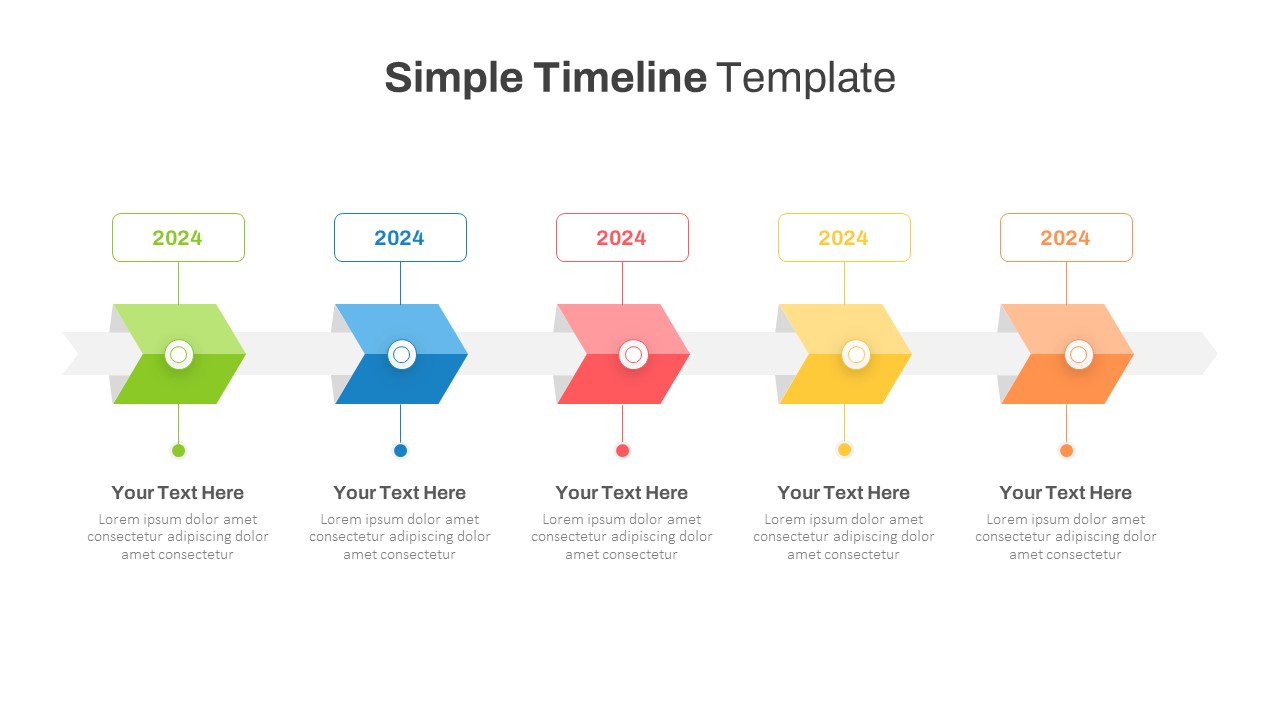
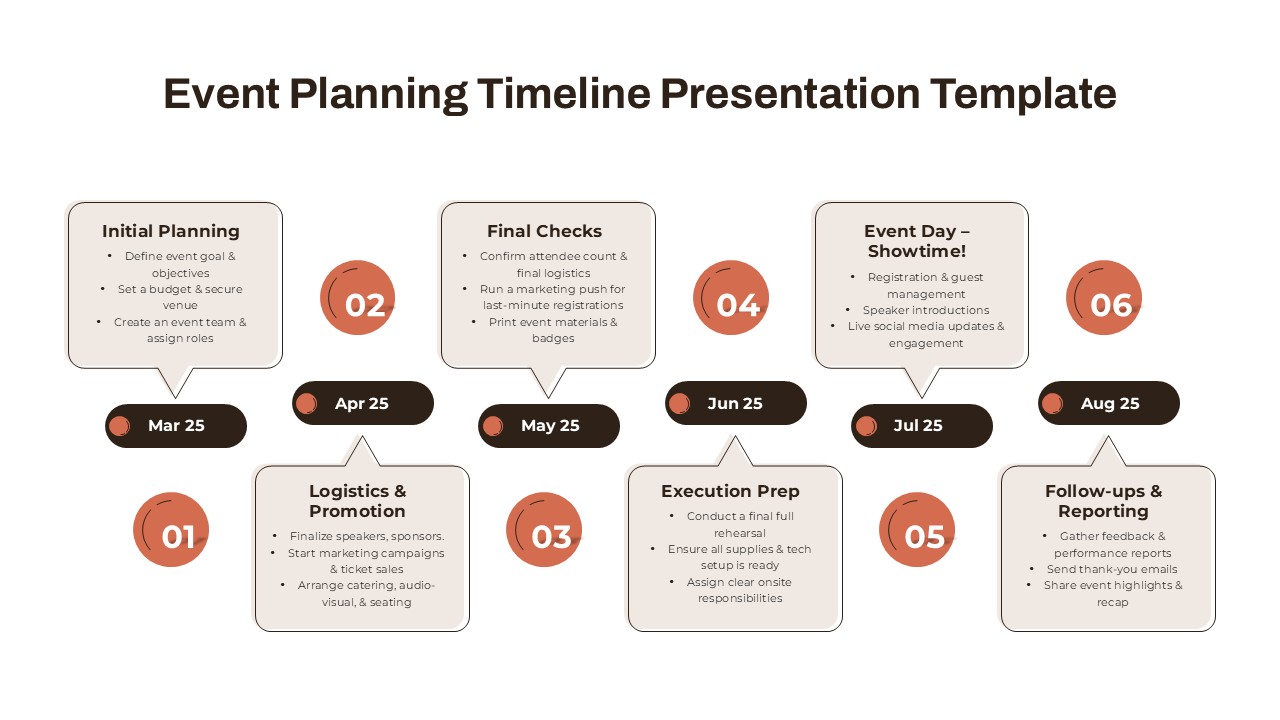
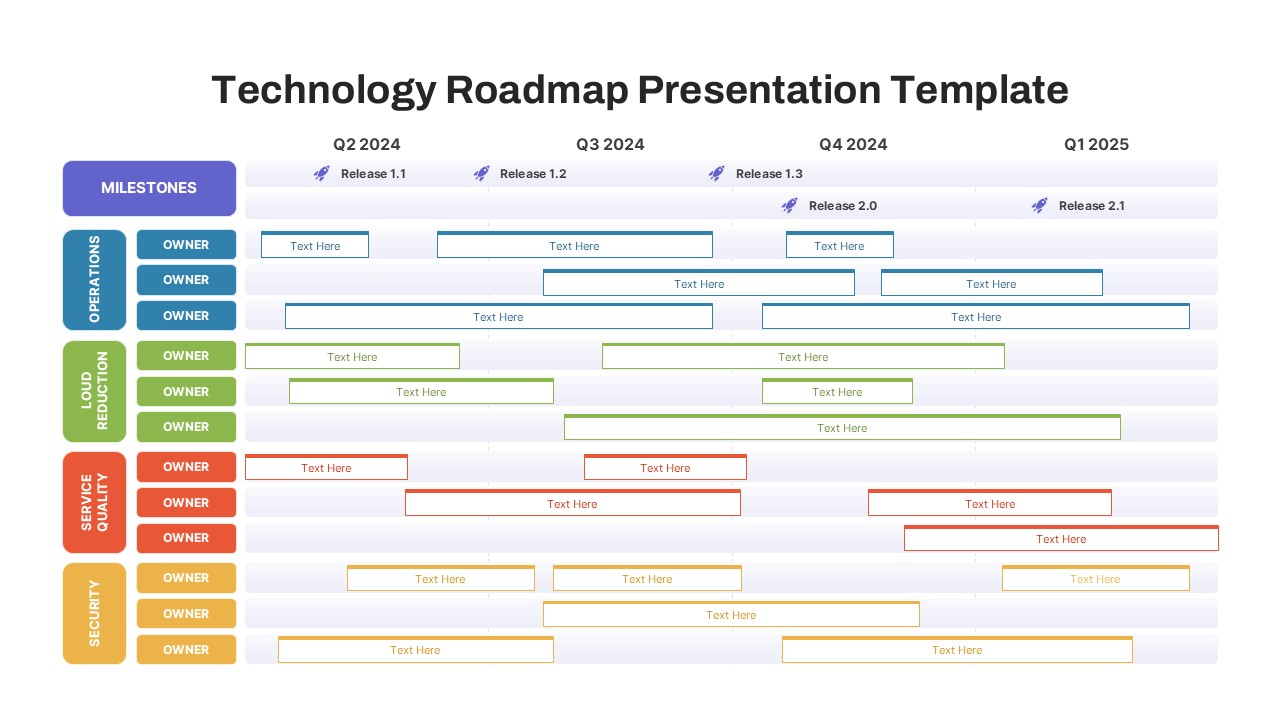
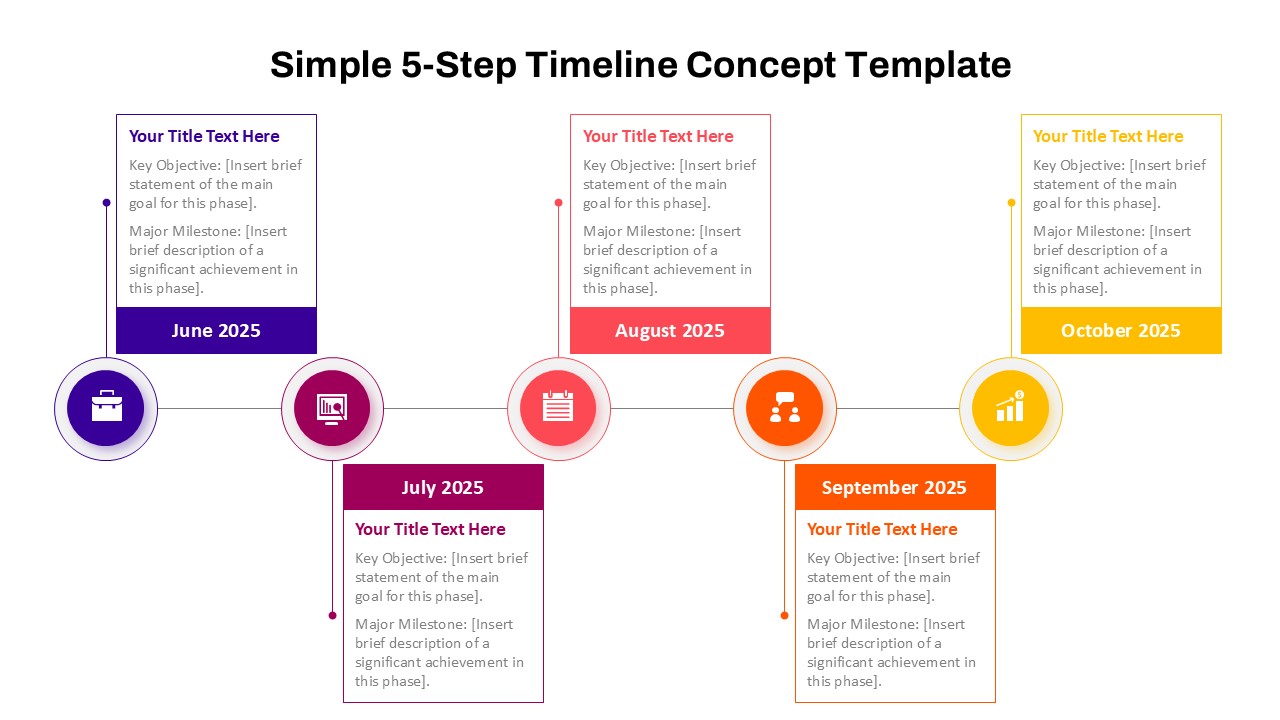
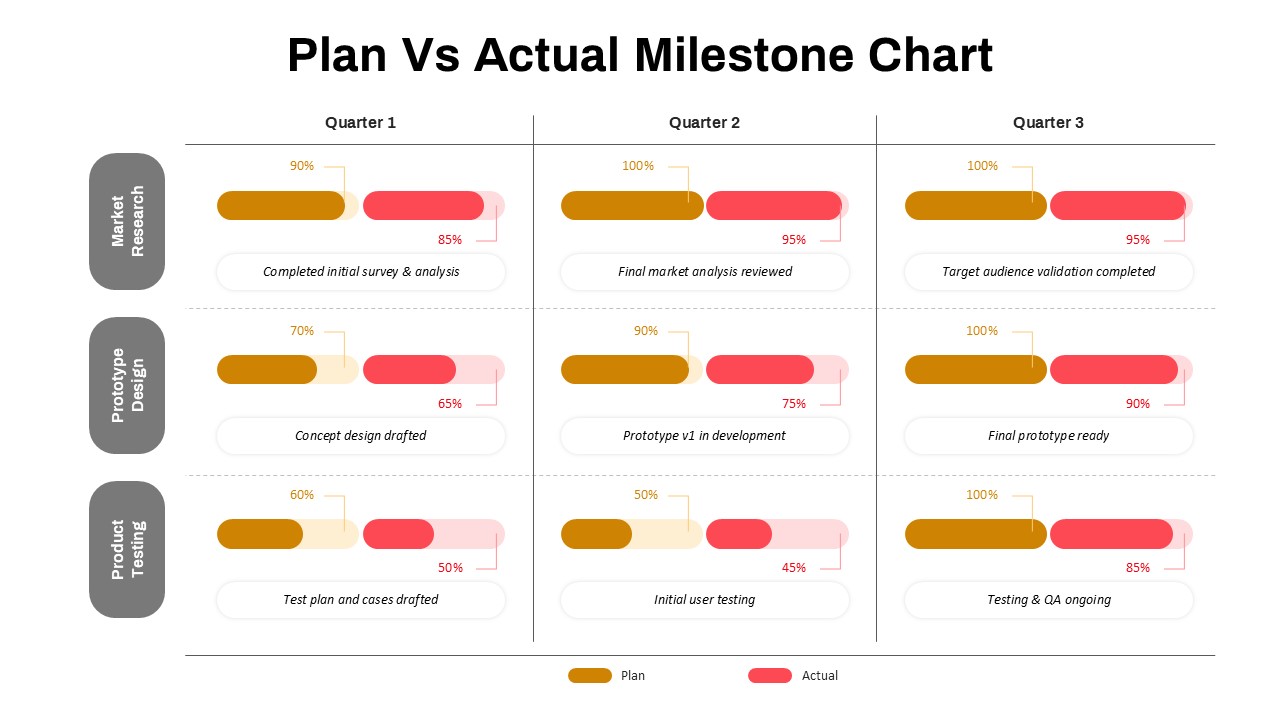
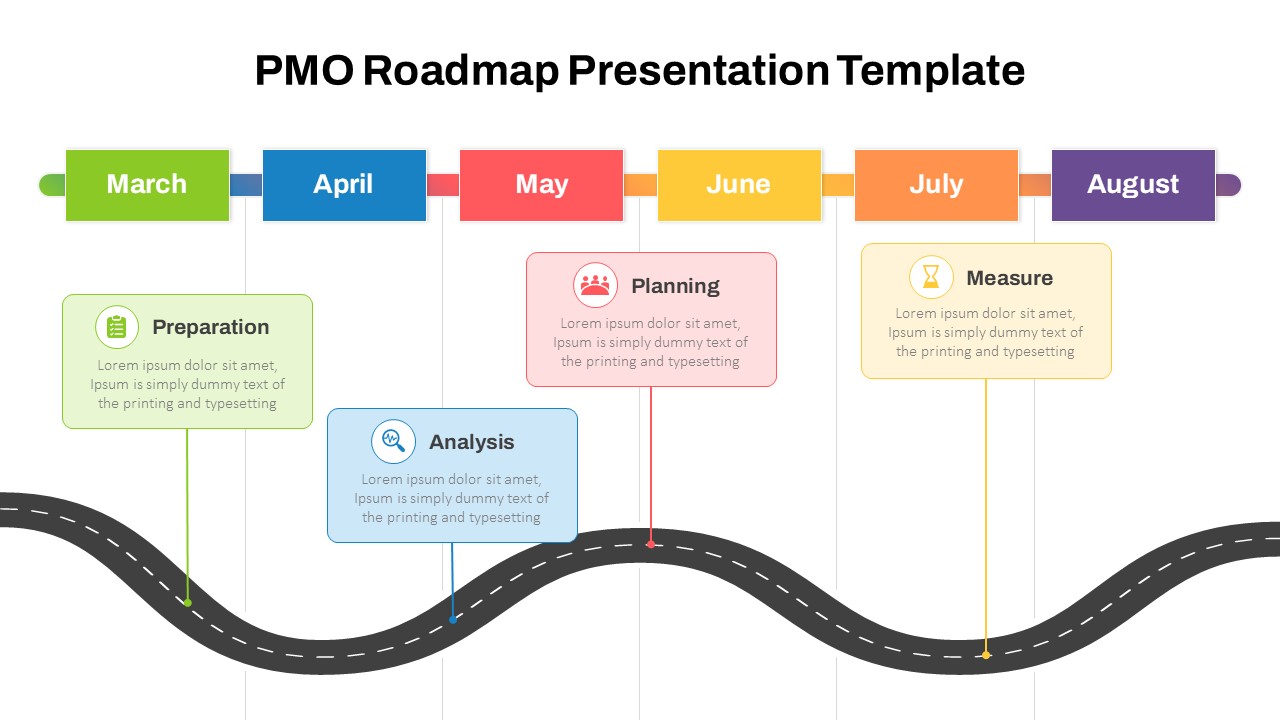
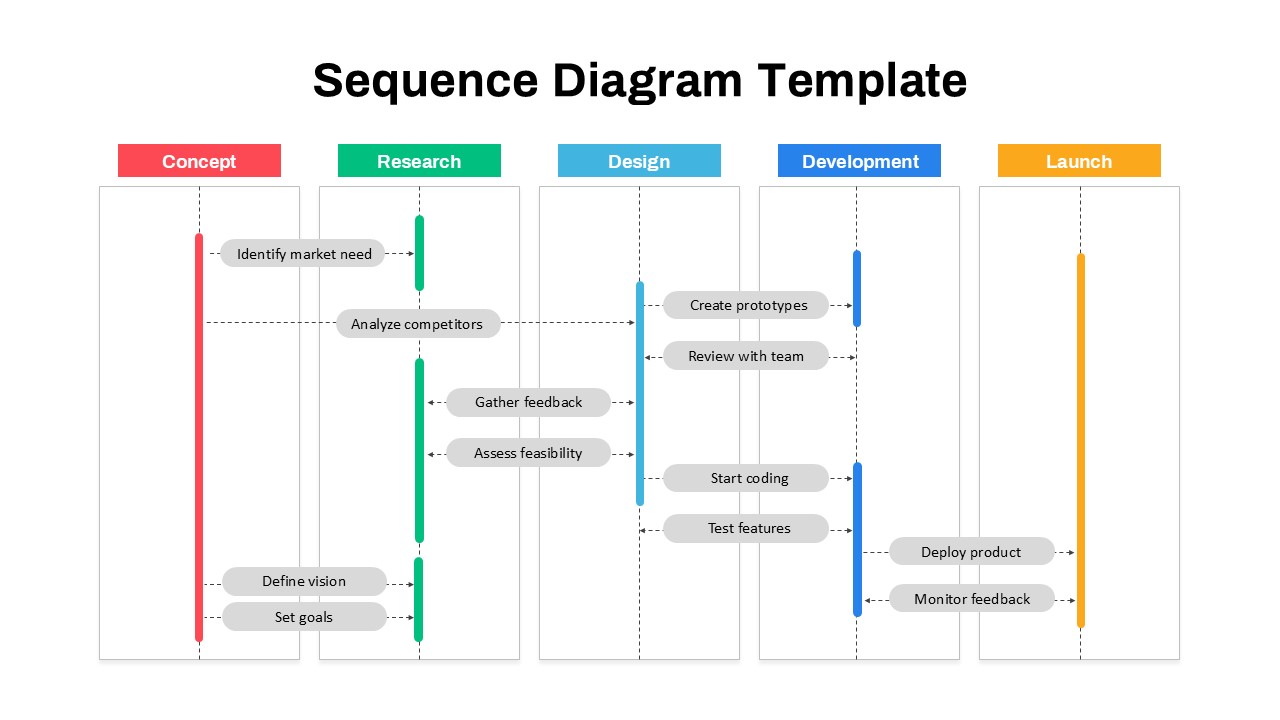
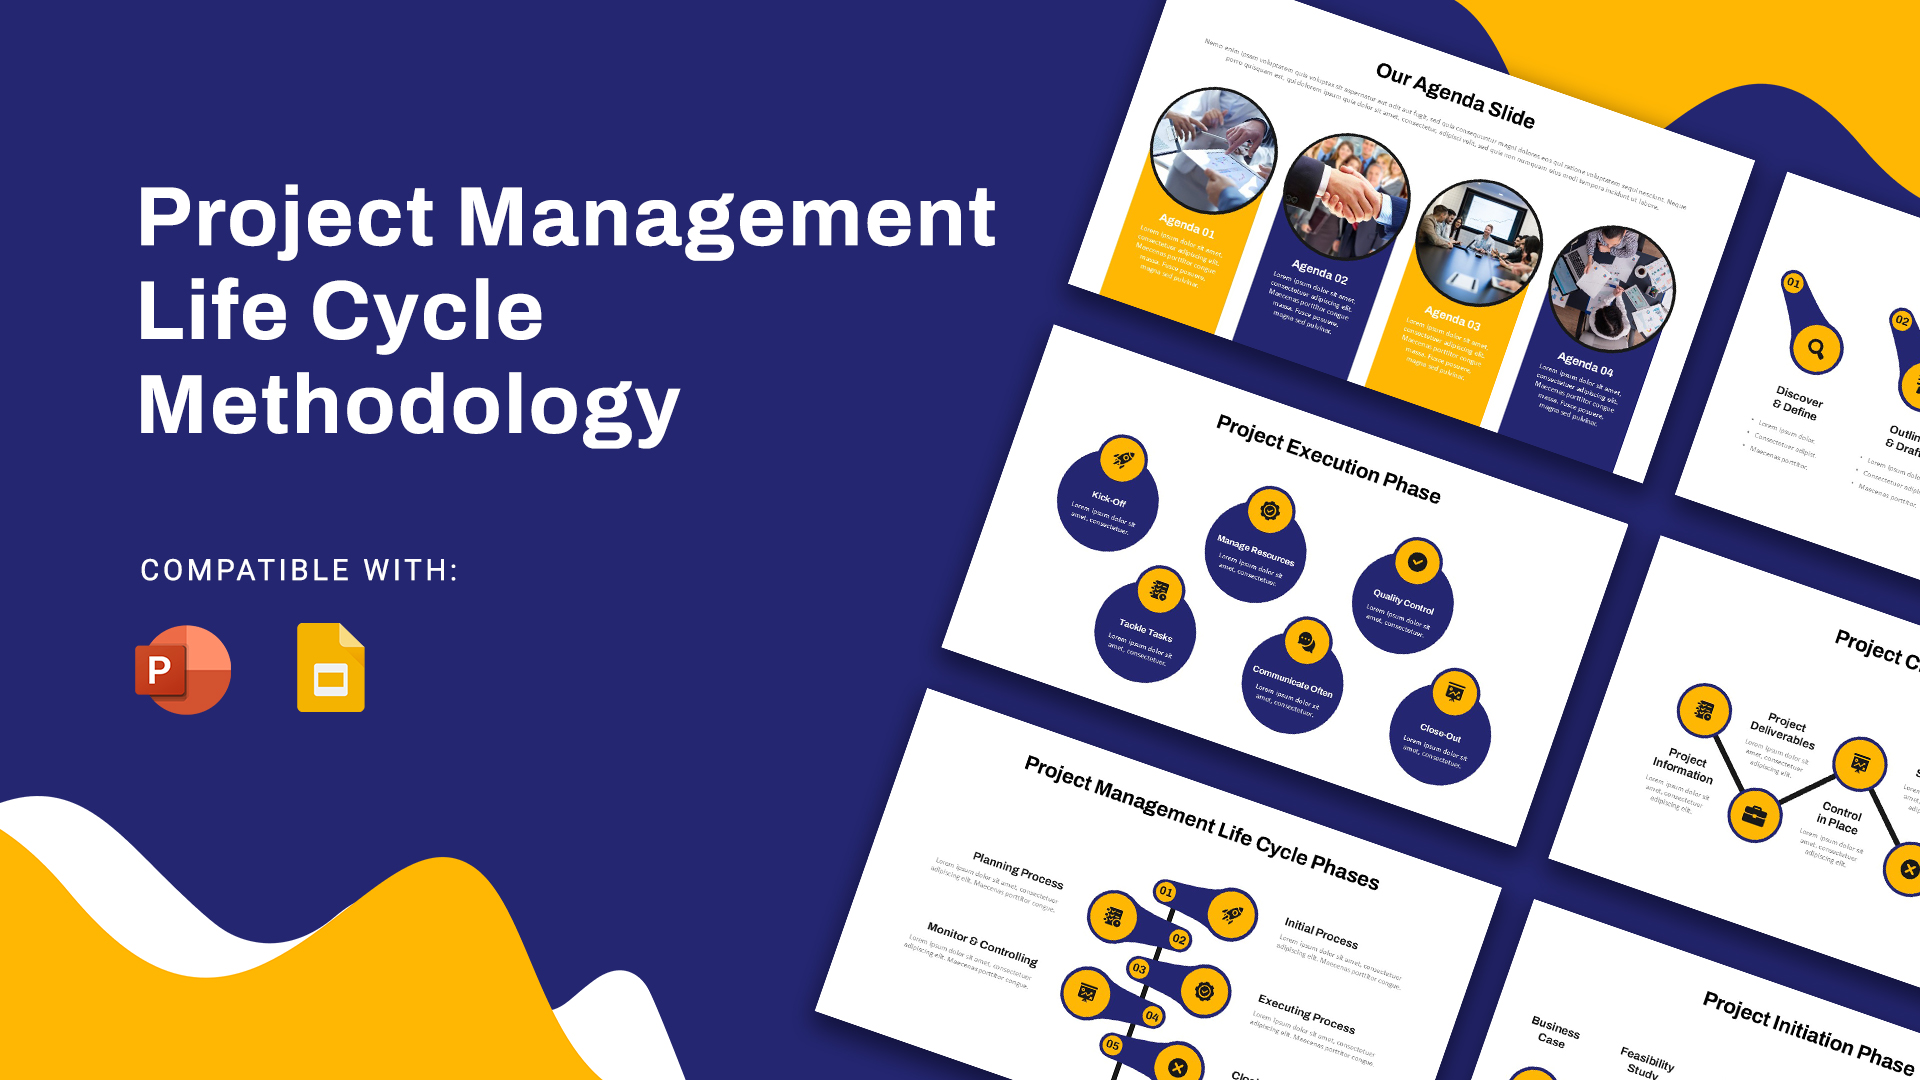
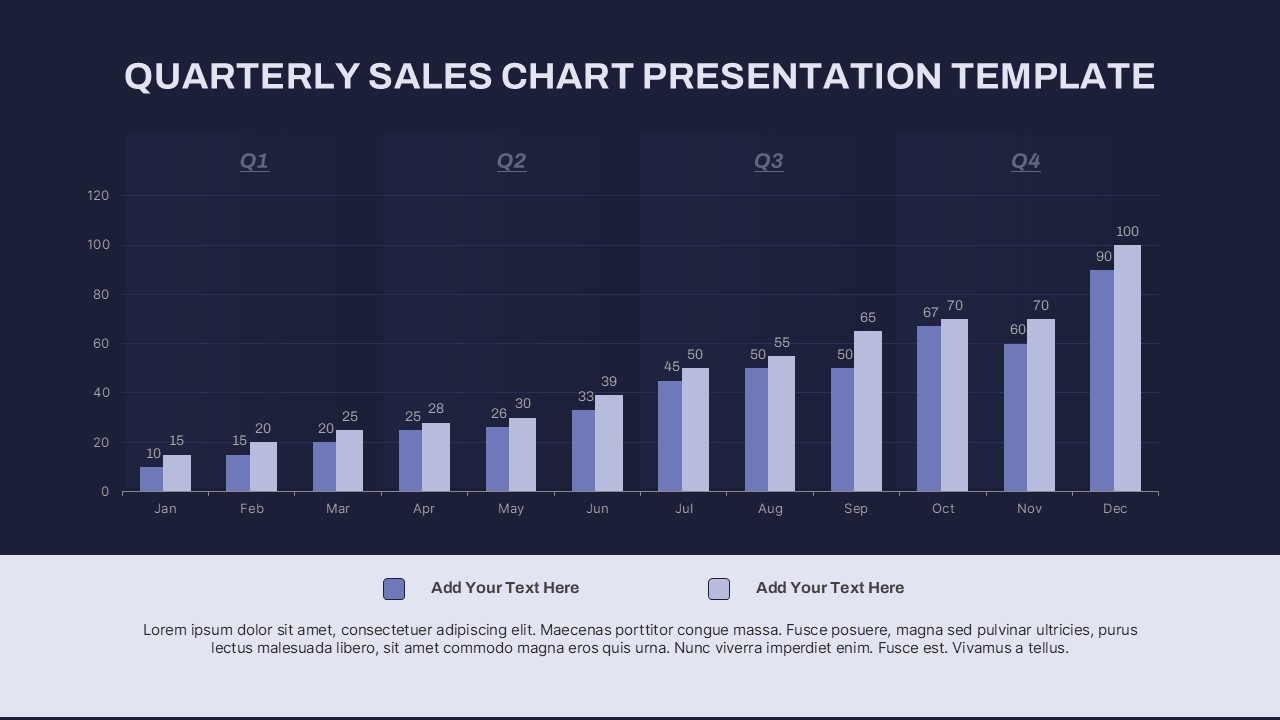
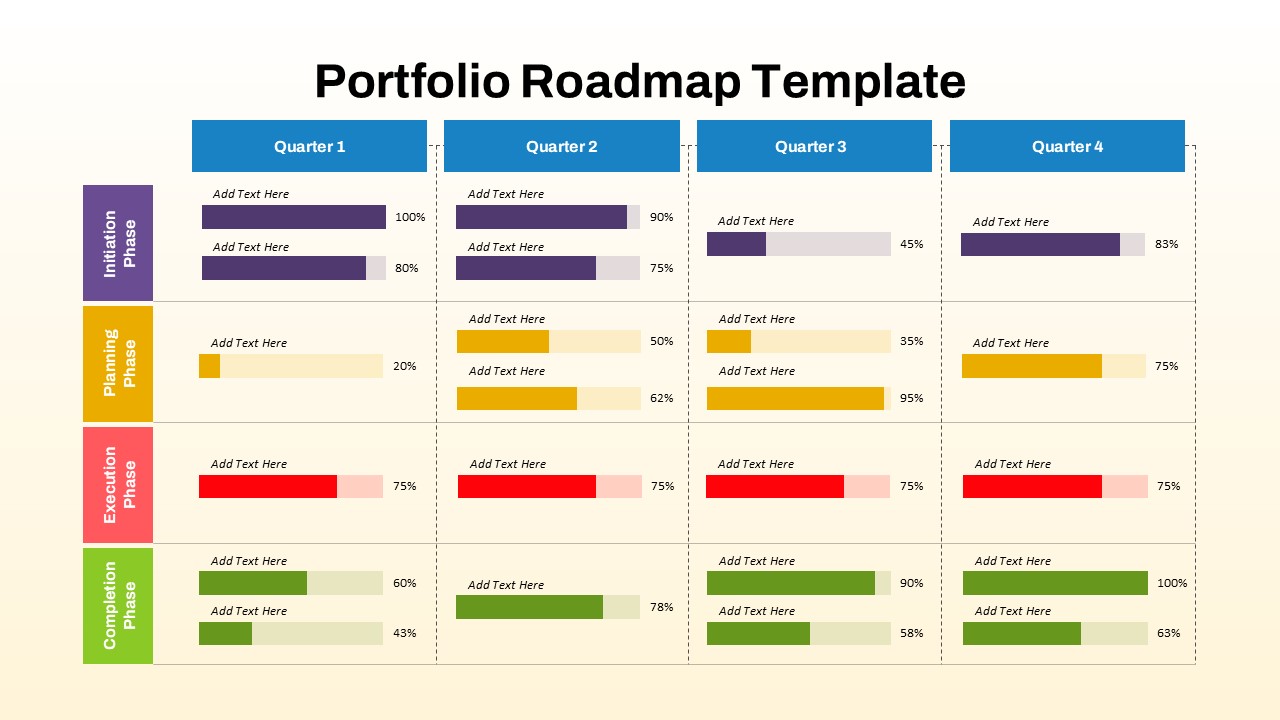
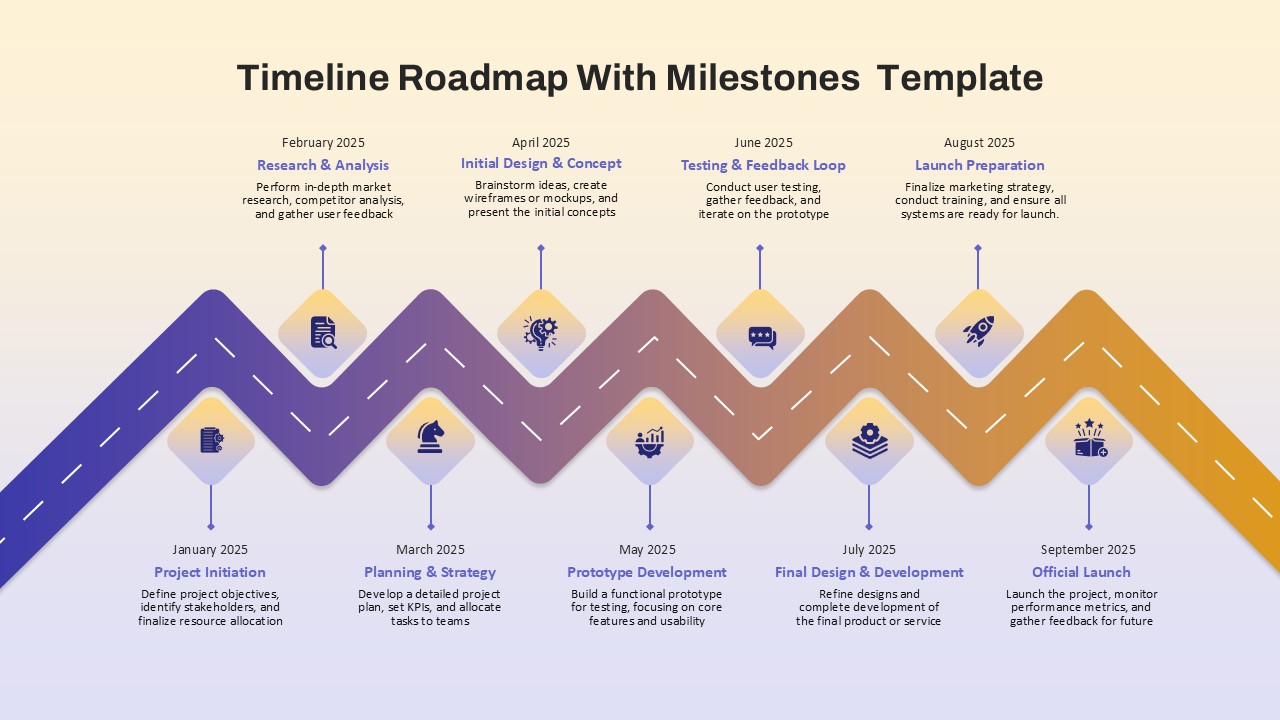
With clearly labeled rows for key project phases—Planning, Research, Design, Implementation, and Follow-Up—this slide provides a straightforward visual overview of when each task begins and ends. Each phase is color-coded and aligned to specific months within the Q1 to Q4 breakdown, making it easy to communicate task durations and deadlines across teams and departments.
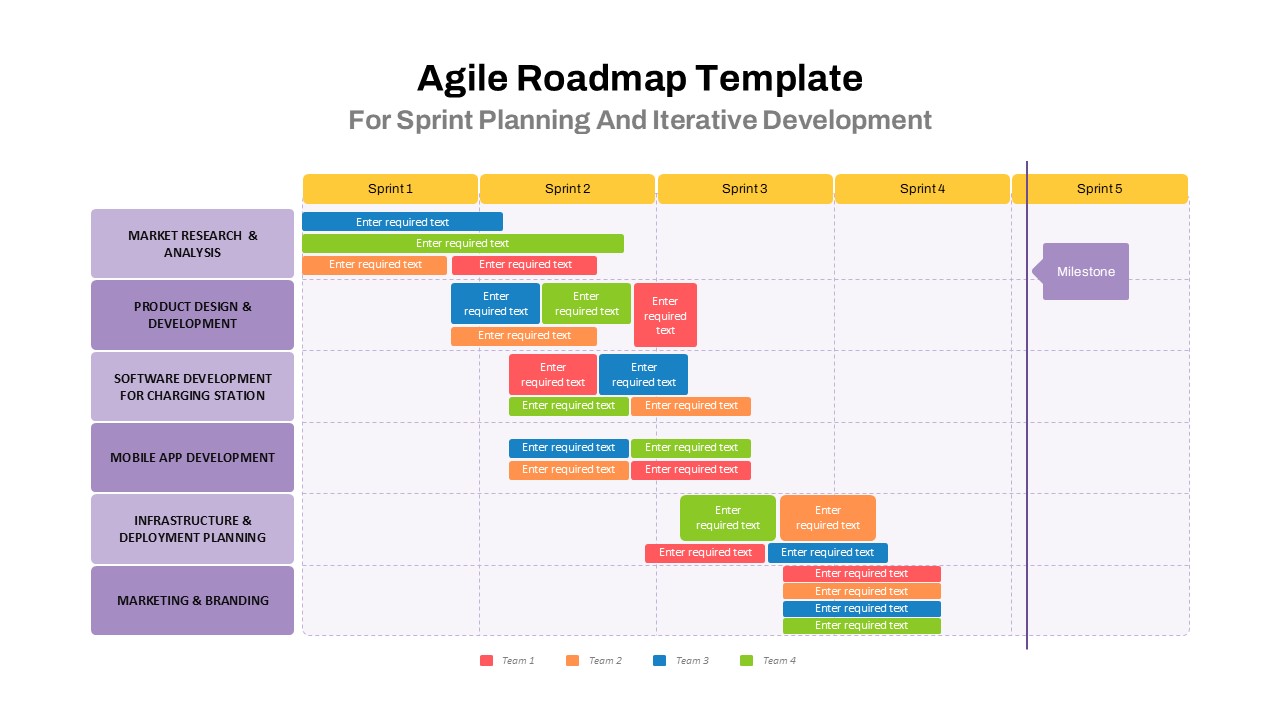
Whether you’re preparing for internal presentations, strategic planning sessions, or status updates, this gantt diagram powerpoint template ensures that project timelines are communicated clearly. The intuitive design makes it accessible for non-technical stakeholders while remaining highly functional for experienced project managers. It supports better forecasting, risk mitigation, and team alignment throughout the project lifecycle.
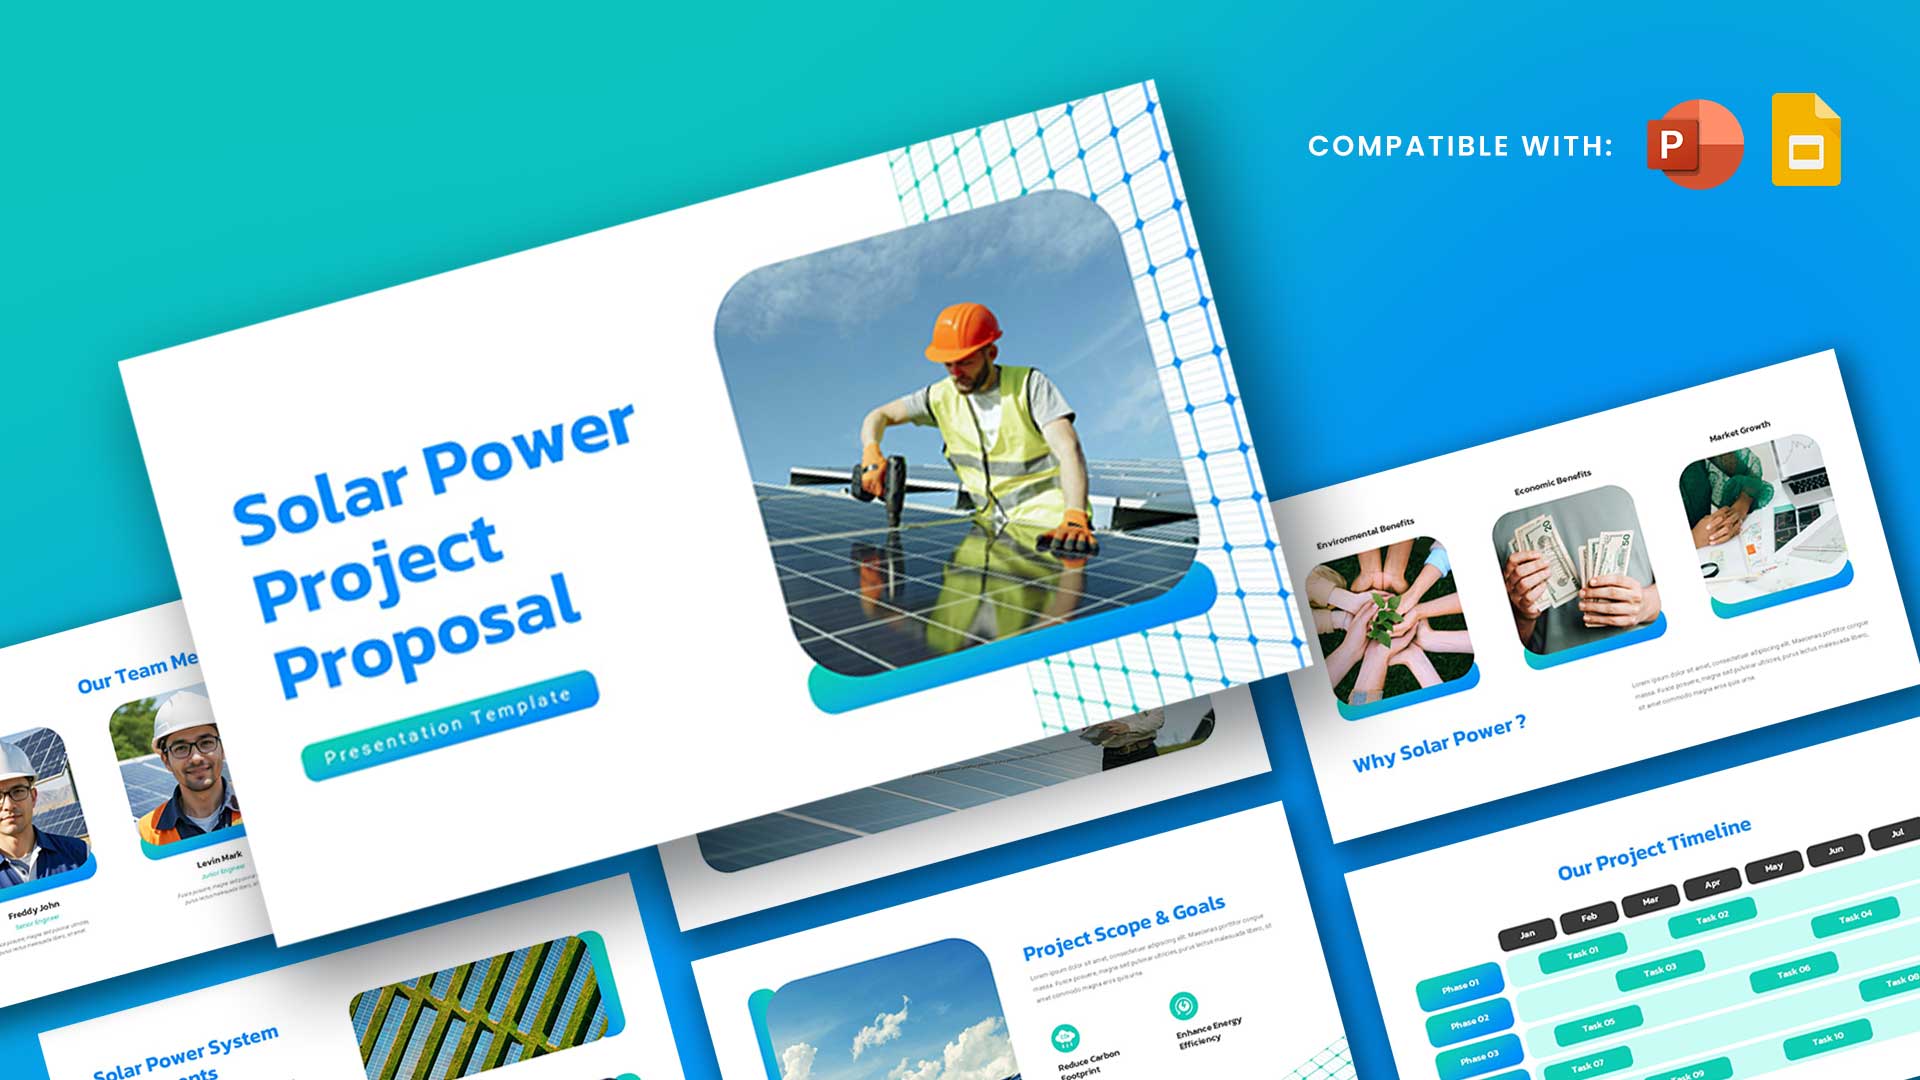
Fully compatible with both PowerPoint and Google Slides, this editable template saves time and enhances clarity in your workflow planning. Simply update task names and durations to tailor it to your project needs.
See more

Aspect Ratio
16:9Item ID
SKT03693
Features of this template
Other User Cases of the Template
Project kickoff presentations, product launch timelines, academic research planning, marketing campaign scheduling, software development sprints, client progress reports, resource allocation meetings, annual strategic planning sessions
FAQs
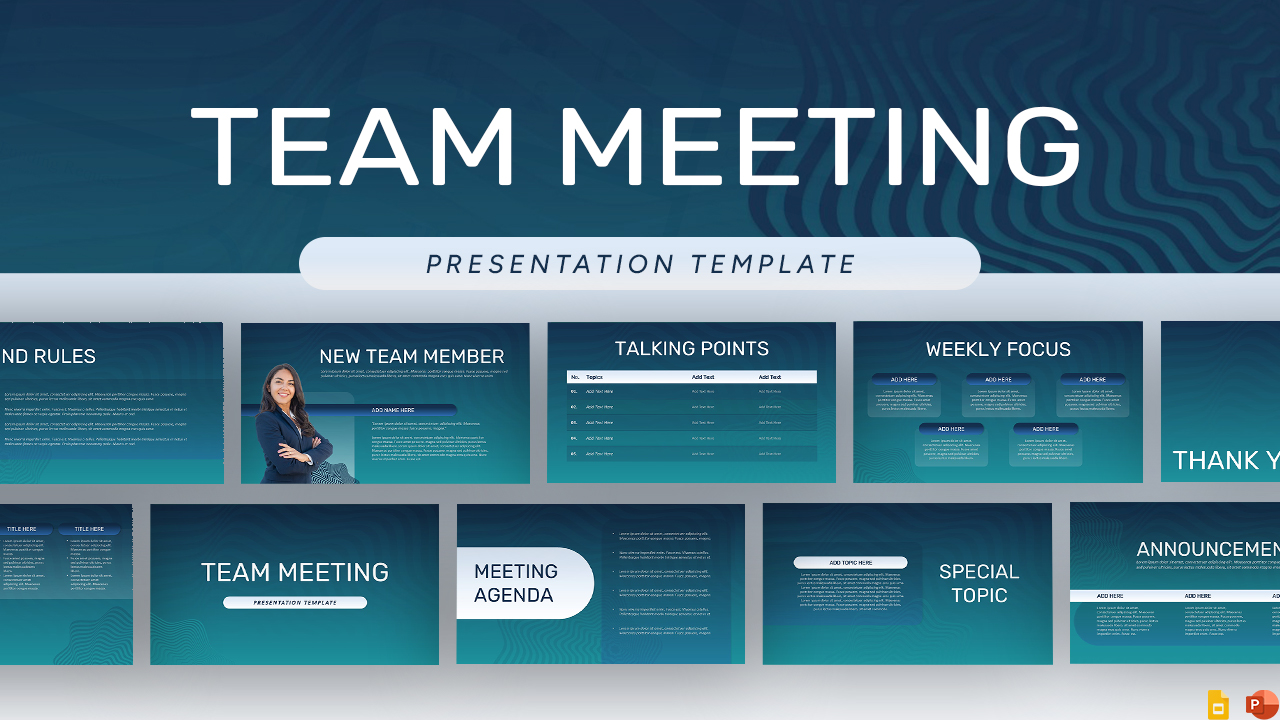
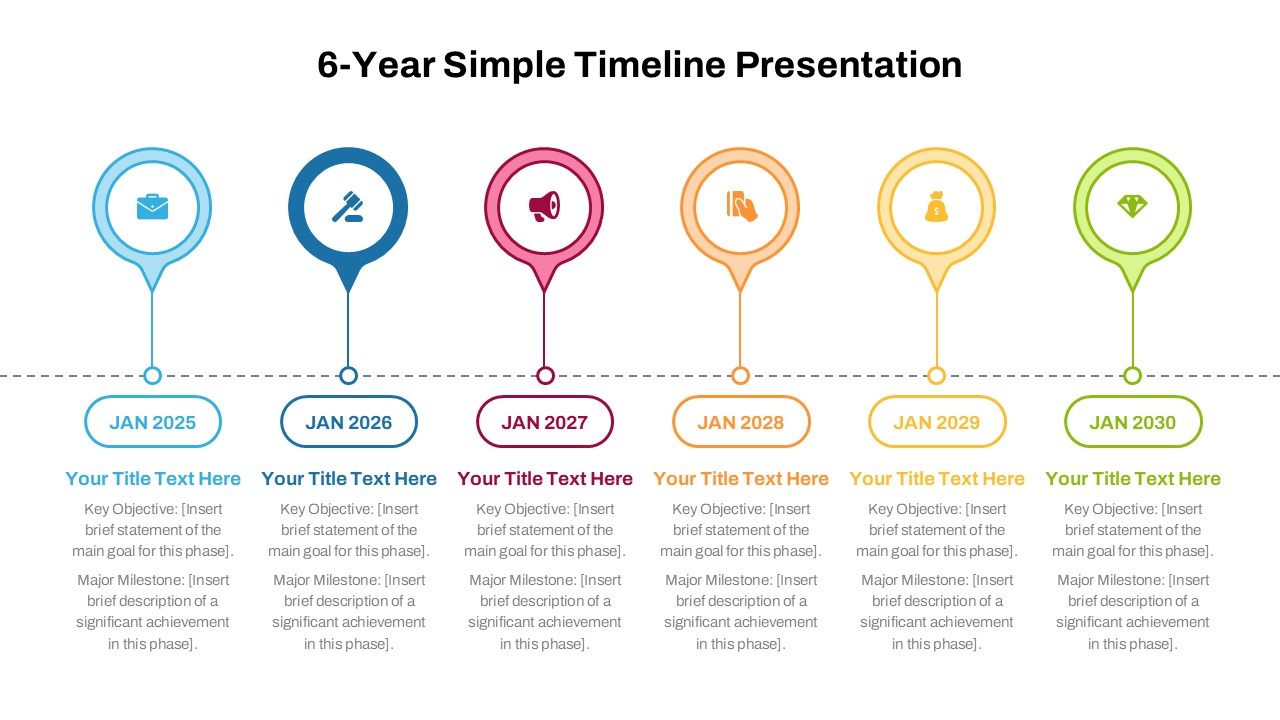
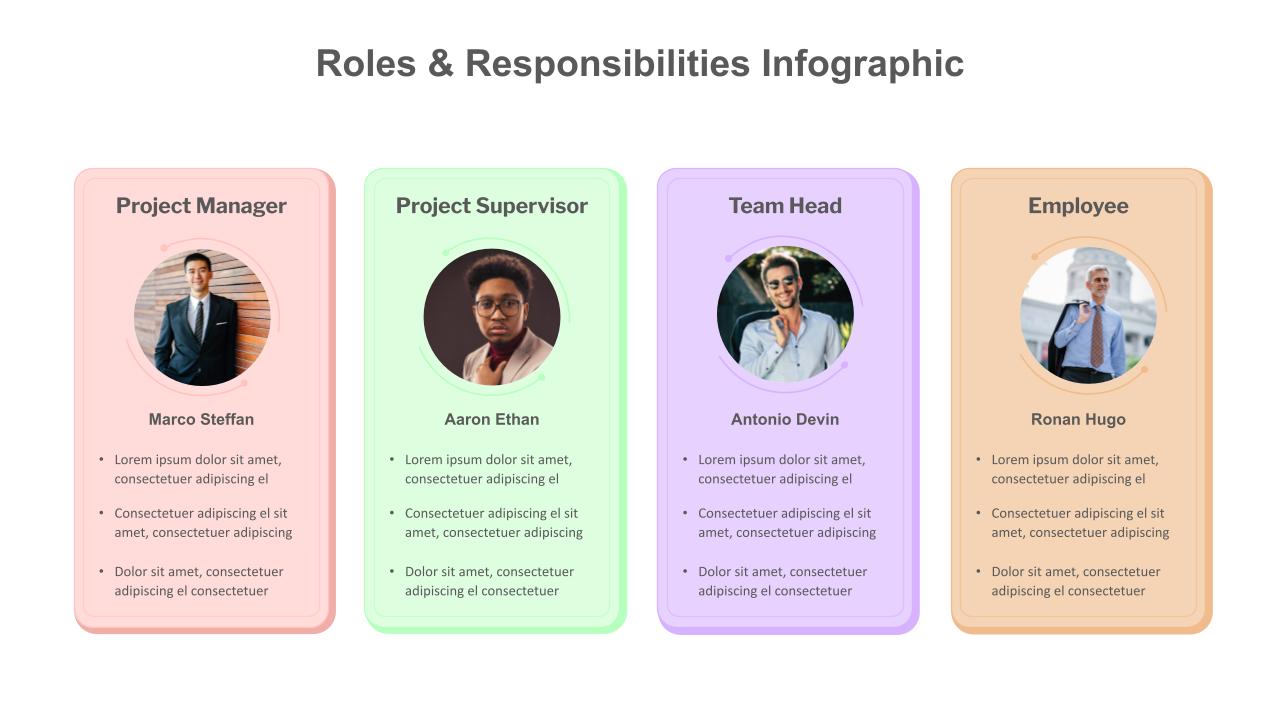
You May Also Like These Presentation Templates


- Free
- Free
- Free
- Free
- Free
- Free
- Free