Customer CTQ Flow Diagram Template for PowerPoint & Google Slides
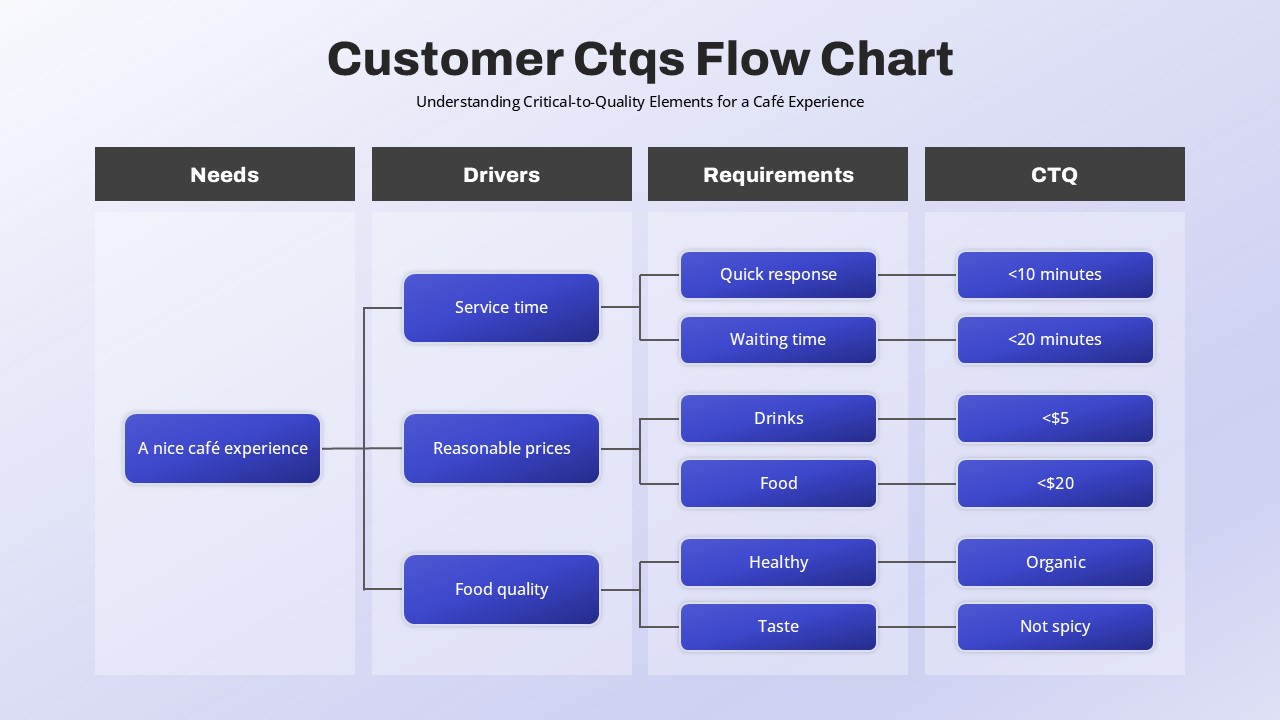
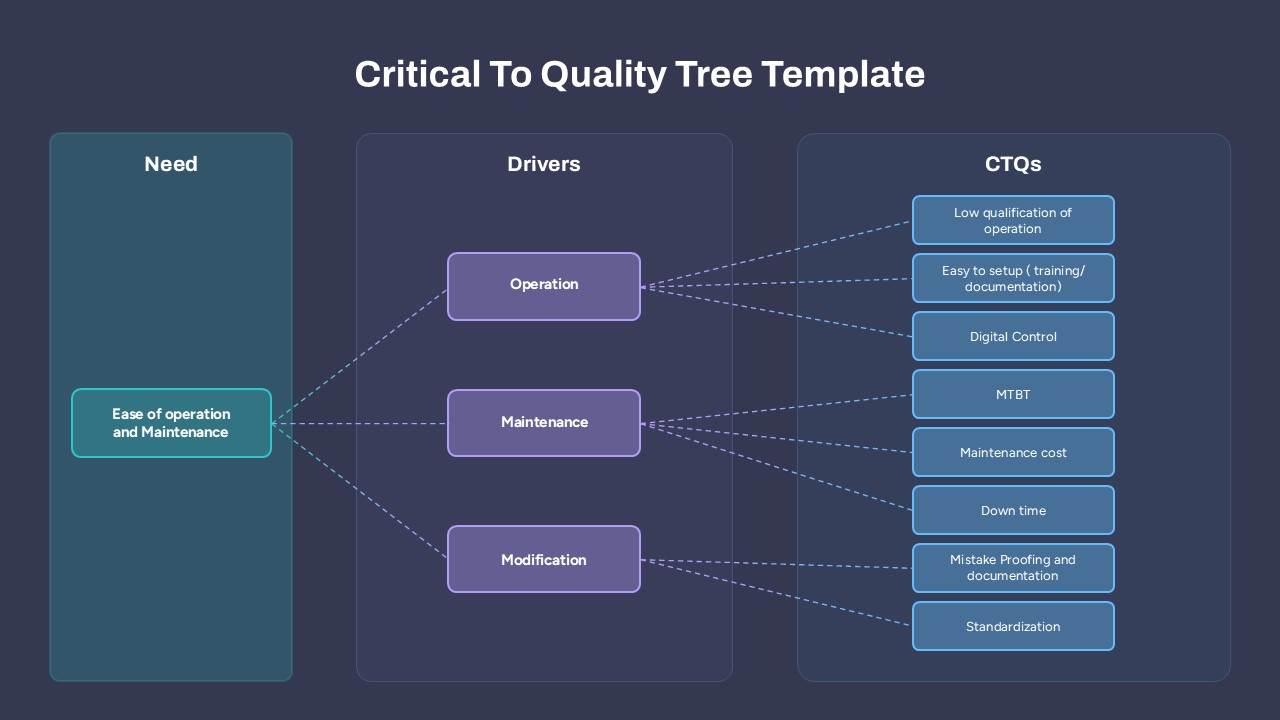
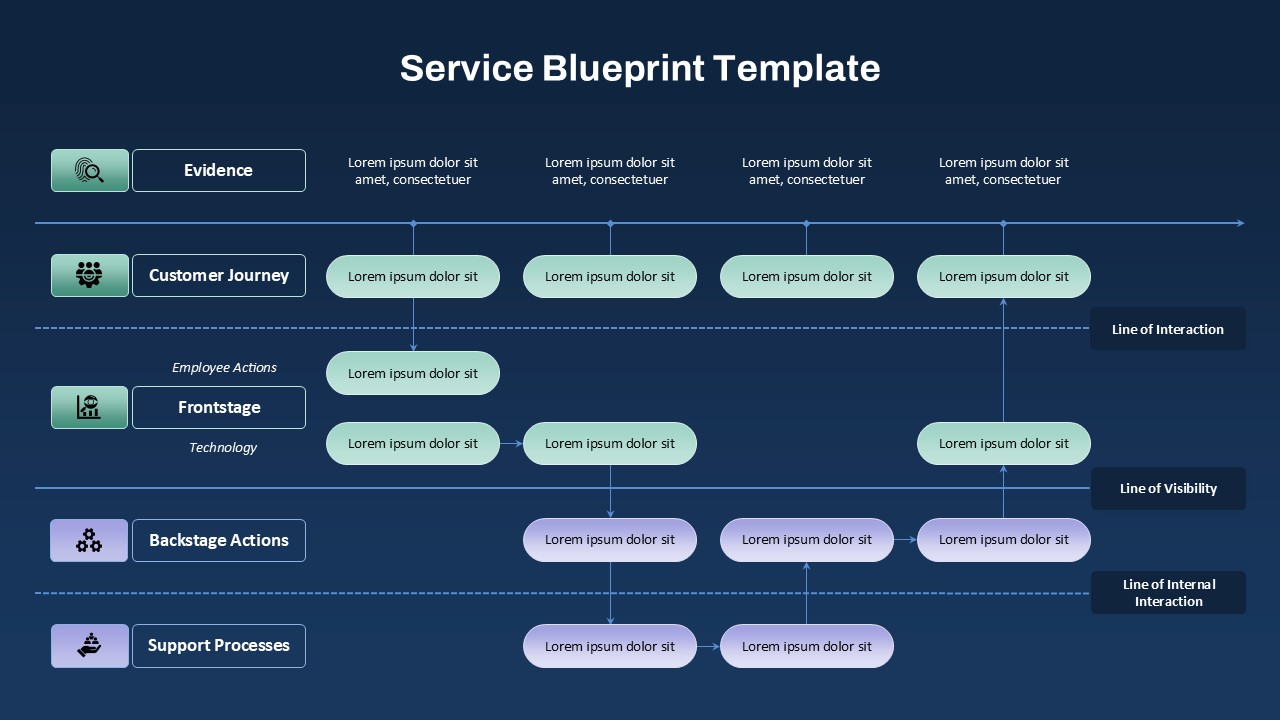
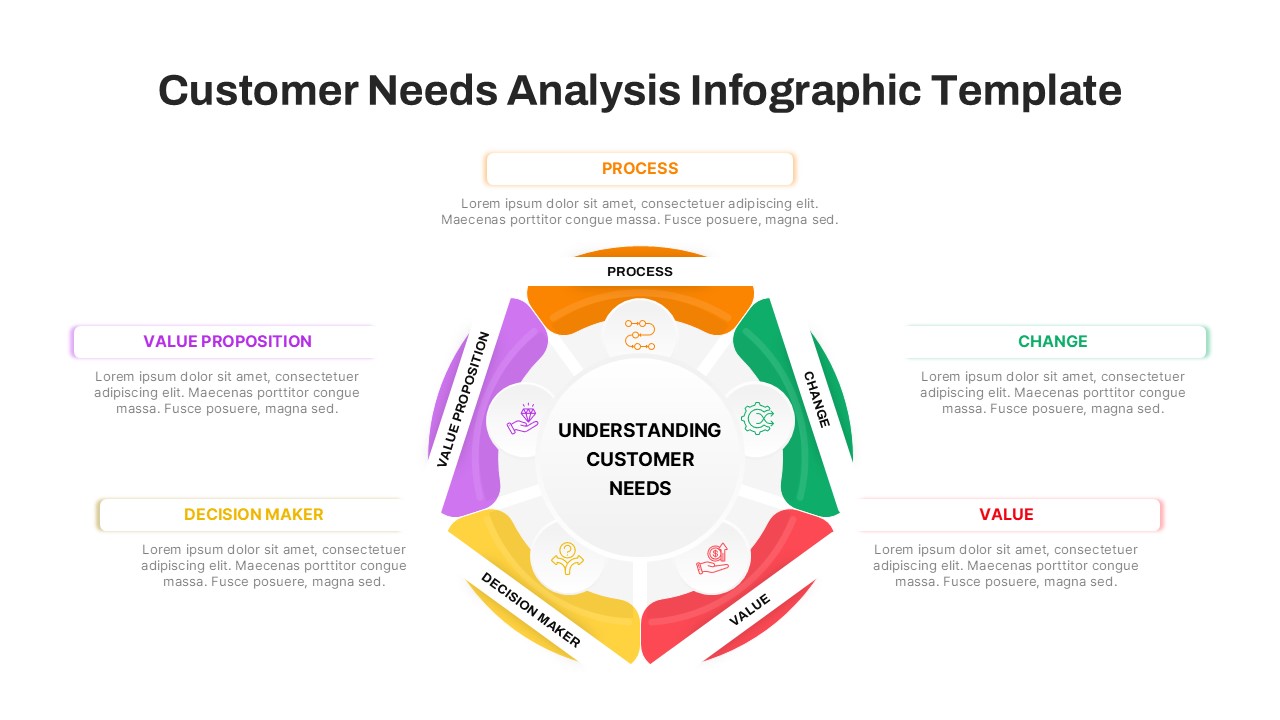
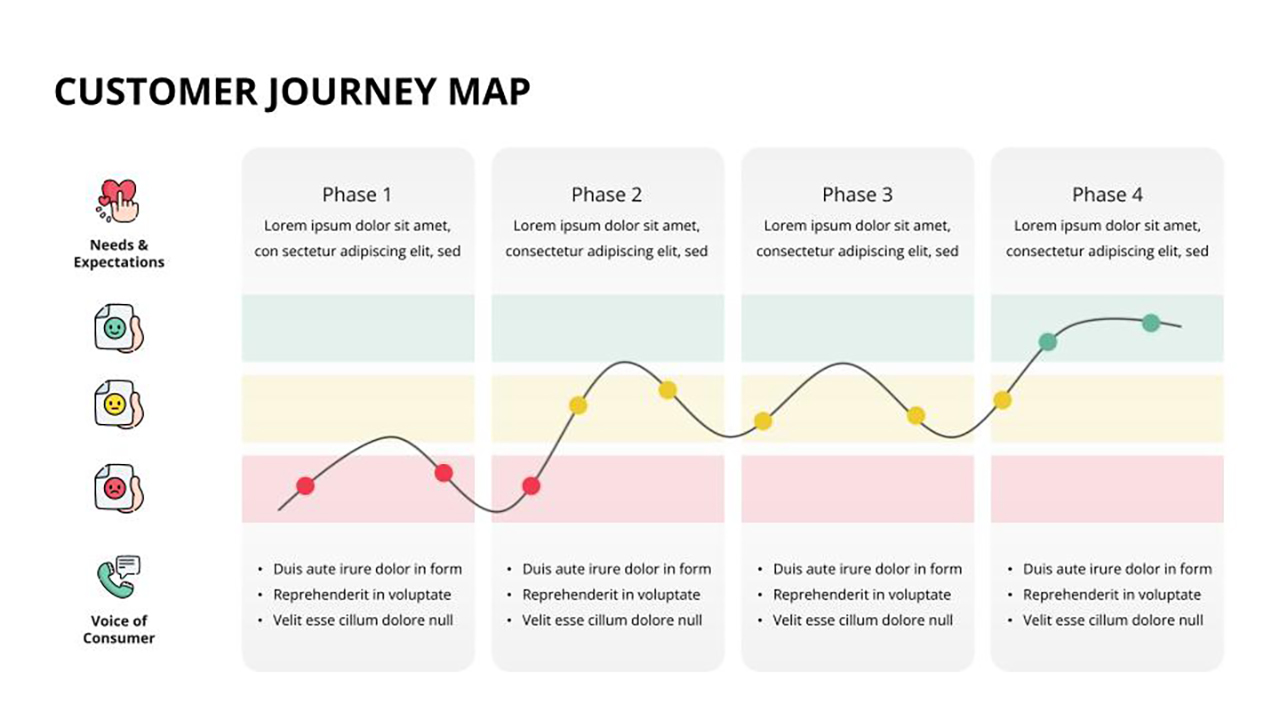
This Customer CTQ (Critical-to-Quality) Flow Chart slide visually breaks down key service components that define a quality café experience. Designed as a left-to-right logical flow, the diagram connects four core categories—Customer Needs, Key Drivers, Specific Requirements, and Quantifiable CTQ Metrics—through clean, color-coded process blocks. Starting with the overarching goal of “A nice café experience,” the slide maps out drivers like service time, pricing, and food quality, then drills down into actionable requirements such as quick response, affordability, and health-conscious offerings. Each of these leads to a measurable CTQ, such as “<10 minutes” wait time or “<$5” for drinks, offering a practical framework for quality management teams.
With its soft gradient background, rounded rectangles, and evenly spaced columns, the template ensures visual clarity while maintaining a modern aesthetic. The use of blue as the dominant color communicates professionalism and trust, ideal for stakeholder reviews, customer experience analysis, or operational improvements. Fully editable and built with vector shapes, this slide allows easy customization of icons, metrics, and terminology.
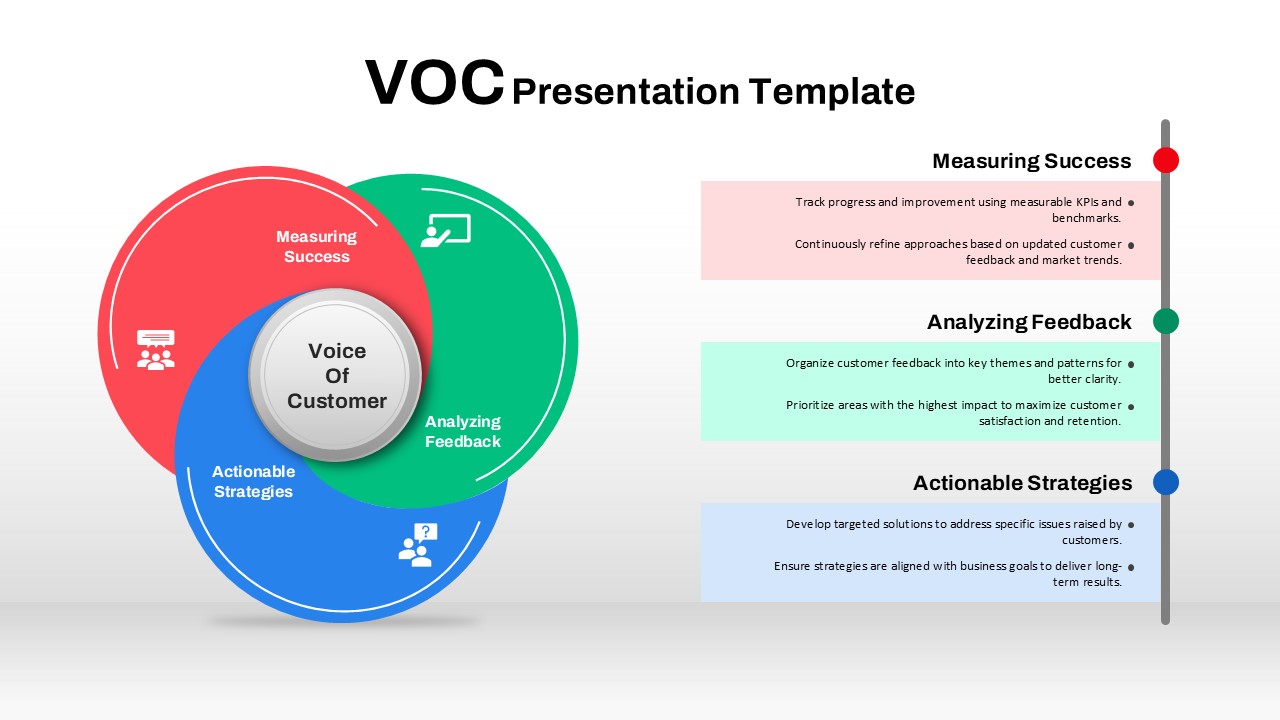
Whether you’re mapping out Six Sigma project elements, presenting VOC (Voice of Customer) insights, or leading a service quality workshop, this flowchart serves as a ready-made structure for illustrating the path from customer expectations to measurable standards.
See more

Aspect Ratio
16:9Item ID
SKT04180
Features of this template
Other Uses
Beyond cafés, this visual can be adapted for any service-based business looking to map CTQ elements—from healthcare services and retail chains to customer support and logistics workflows. Repurpose the categories to fit any industry-specific customer journey.
FAQs
You May Also Like These Presentation Templates


- Free

- Free
- Free
- Free
- Free

- Free
- Free
- Free