Net Promoter Score Chart Template for PowerPoint & Google Slides
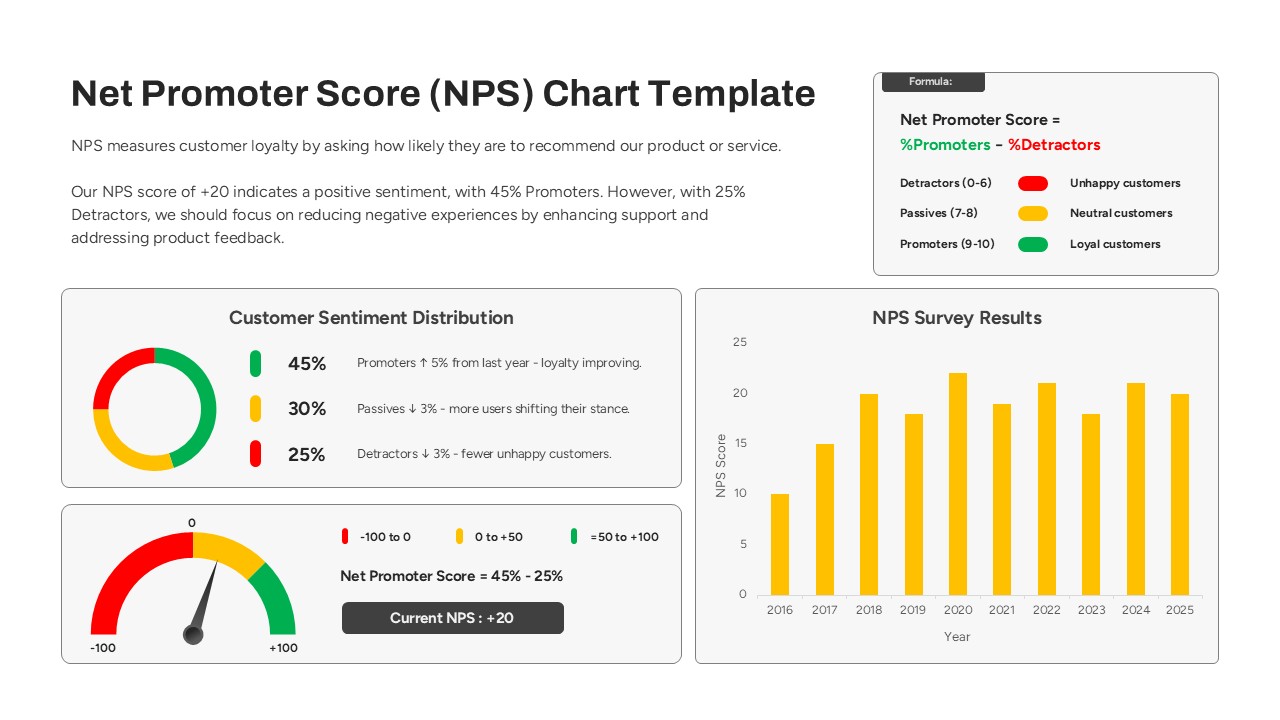
The Net Promoter Score (NPS) Template is an essential tool for businesses looking to measure and visualize customer loyalty. NPS is a key metric used to gauge how likely customers are to recommend your product or service, providing valuable insights into customer satisfaction and potential areas for improvement.
This dashboard ppt template is designed to present NPS data in a clear and engaging way, featuring a customer sentiment distribution chart, a detailed NPS score gauge, and a historical trend graph. The NPS Survey Results graph tracks the yearly progress of your Net Promoter Score, allowing you to visualize shifts in customer loyalty over time. The customer sentiment distribution section breaks down your audience into three categories: Promoters, Passives, and Detractors, helping you pinpoint where you are excelling and where adjustments are needed.
The colorful and easy-to-understand layout ensures that key data is presented clearly, making it an ideal tool for quarterly business reviews, customer experience reports, and strategic planning sessions. Compatible with both PowerPoint and Google Slides, this template can be easily customized to fit your company’s branding and specific metrics.
Whether you’re analyzing your NPS to improve customer service, refine product offerings, or showcase results to stakeholders, the Net Promoter Score (NPS) Chart Template provides a professional, visually compelling way to communicate your customer loyalty insights.
See more

Aspect Ratio
16:9Item ID
SKT03605
Features of this template
Other User Cases of the Template
Customer loyalty analysis, business performance reviews, NPS survey presentations, market research reporting, customer satisfaction reports, product feedback analysis, quarterly performance updates, marketing campaign effectiveness tracking, client retention presentations, strategic business planning
FAQs
You May Also Like These Presentation Templates


- Free
- Free

- Free
- Free


- Free


- Free