
How to Present a Profit and Loss Statement in PowerPoint
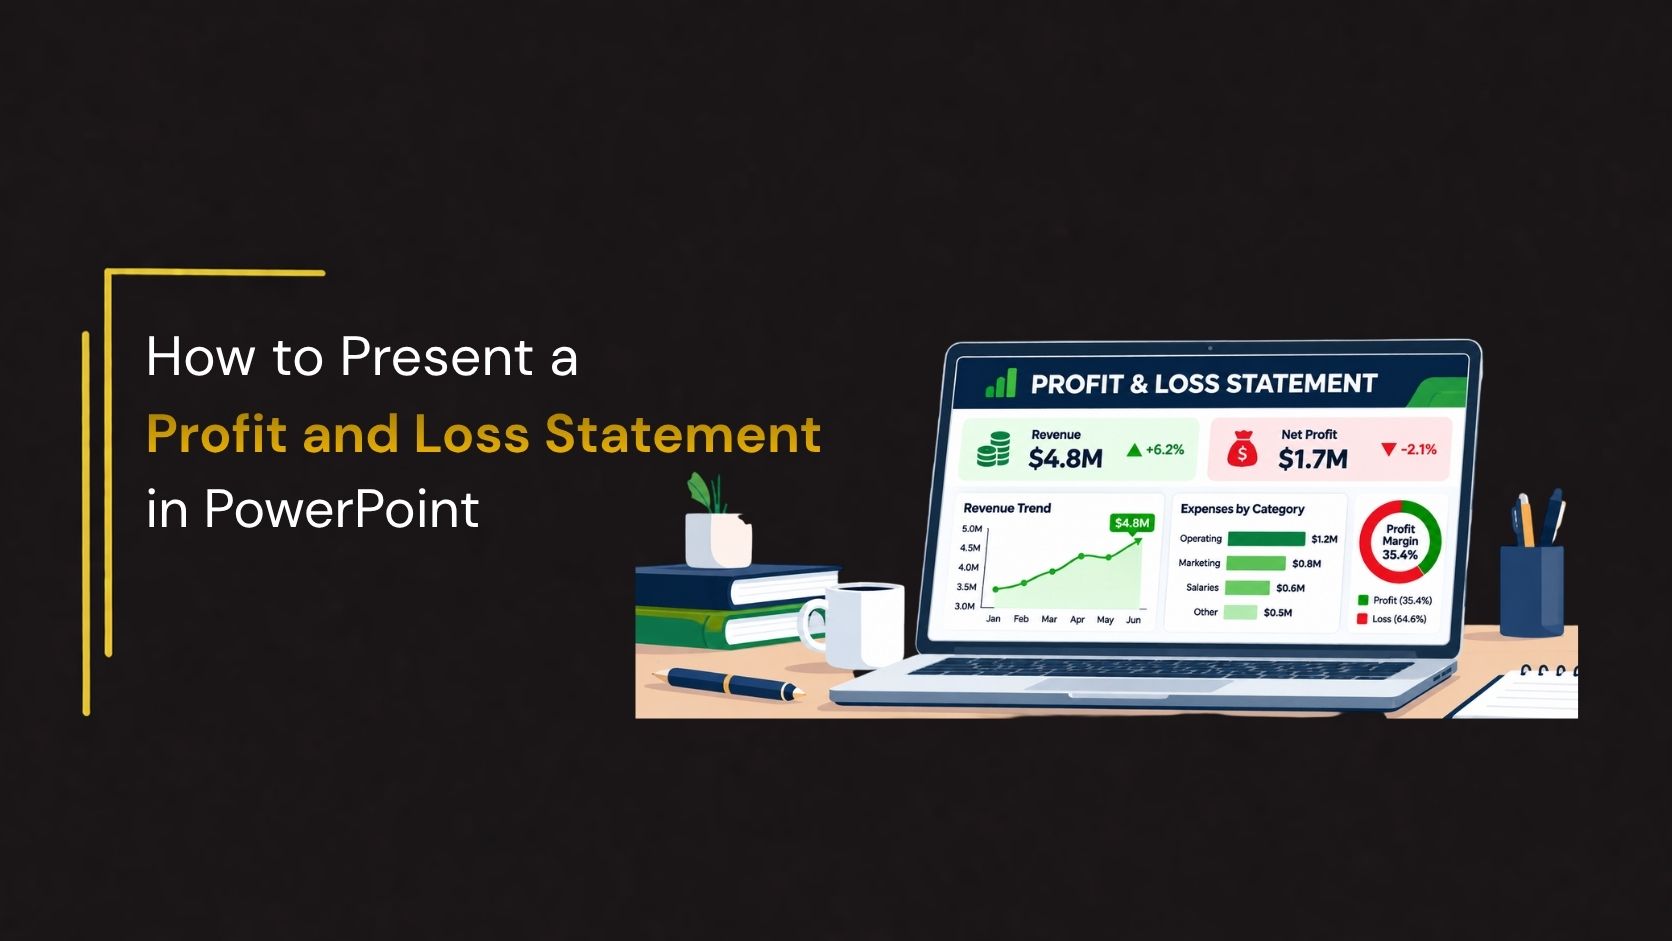
Financial information plays an important role in business planning, performance reviews, and strategic decision-making. A Profit and Loss (P&L) statement helps businesses understand how much revenue they generate, what they spend, and whether they make a profit or incur a loss during a specific period. However, presenting a detailed financial statement in PowerPoint can be challenging when it contains numerous figures, expense categories, and calculations.
A well-designed Profit and Loss statement presentation transforms financial figures into meaningful insights. Instead of displaying rows of numbers, presenters can use organized tables, charts, financial dashboards, and visual comparisons to explain business performance. Whether you are preparing a monthly financial review, quarterly business report, annual performance presentation, or investor meeting, PowerPoint can help communicate financial results clearly.
This guide explains how to present a Profit and Loss statement in PowerPoint, understand its essential components, choose suitable charts, organize financial information, and use ready-made SlideKit templates to create professional financial presentations.
A Profit and Loss (P&L) statement, also called an income statement, summarizes a company’s revenue, costs, and expenses over a specific period. It shows whether the business has made a profit or incurred a loss, helping stakeholders evaluate financial performance and make informed decisions.
Key Components of a Profit and Loss Statement
Before creating a P&L presentation, first understand the major financial components and how each contributes to the final profit or loss.
1. Revenue
Revenue represents the income a company earns from its core activities, such as selling products or providing services. Typically, it appears first in the P&L statement and serves as the starting point for calculating profitability.
2. Cost of Goods Sold (COGS)
Cost of Goods Sold includes the direct costs associated with producing goods or delivering services. These expenses may include raw materials, direct labor, and manufacturing costs.
3. Gross Profit
Gross profit is the amount remaining after deducting the cost of goods sold from revenue.
Formula: Gross Profit = Revenue − Cost of Goods Sold
4. Operating Expenses
Operating expenses are the costs associated with running daily business activities, excluding the direct costs already included in COGS. These may include:
- Employee salaries and administrative expenses.
- Rent and utility bills.
- Marketing and advertising costs.
- Software subscriptions.
5. Operating Profit
Operating profit represents the earnings generated from business operations after deducting operating expenses from gross profit, with other operating income and expenses considered where applicable.
Simplified formula: Operating Profit = Gross Profit − Operating Expenses
6. Non-Operating Income and Expenses
These items arise outside the company’s primary operating activities. Examples may include interest income, interest expenses, and certain investment-related gains or losses.
7. Profit Before Tax (PBT)
Profit before tax represents the earnings remaining after accounting for relevant operating and non-operating items but before deducting income tax.
8. Income Tax
Income tax represents the tax expense recognized for the reporting period. It is deducted to determine the final profit after tax.
9. Net Profit or Net Loss
Net profit is the final amount remaining after all relevant expenses and taxes have been accounted for. If expenses exceed income, the business reports a net loss.
Simplified formula: Net Profit = Total Income − Total Expenses
Five Profit and Loss PowerPoint Templates
Choosing the right presentation layout can make financial reporting easier and more professional. SlideKit offers several Profit and Loss presentation designs that can be used for financial statements, management reviews, dashboards, and performance comparisons.
Here are five useful template designs to consider when preparing your next P&L presentation.
1. Editable Profit and Loss Statement Template
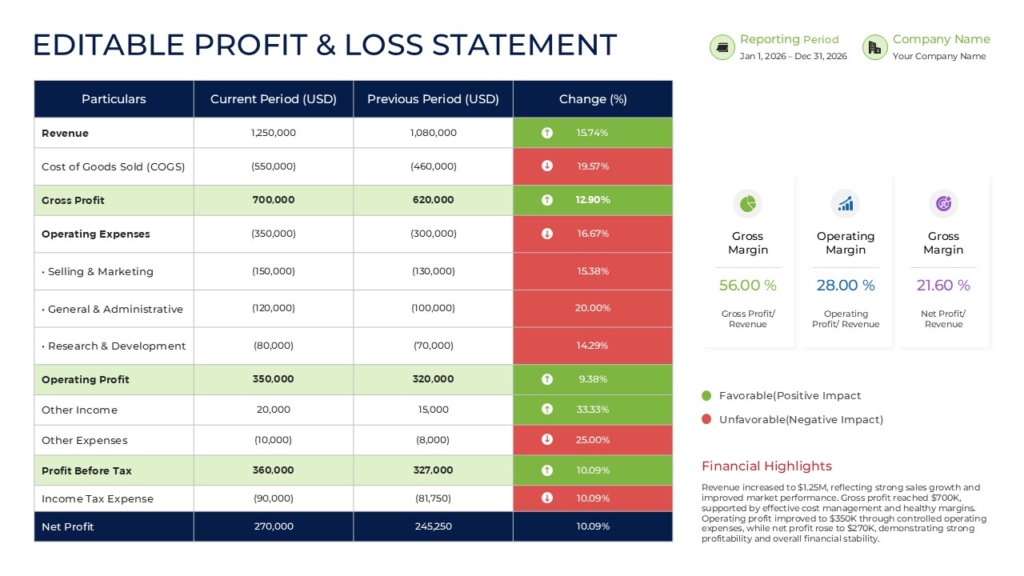
This editable Profit and Loss Statement layout organizes financial figures into a structured table with columns for particulars, current-period results, previous-period results, and percentage changes. It covers key figures, including revenue, costs, gross profit, operating expenses, and net profit.
Use it to: Present monthly or quarterly P&L statements, compare year-over-year results, and communicate important financial movements.
2. Profit and Loss Dashboard Infographic
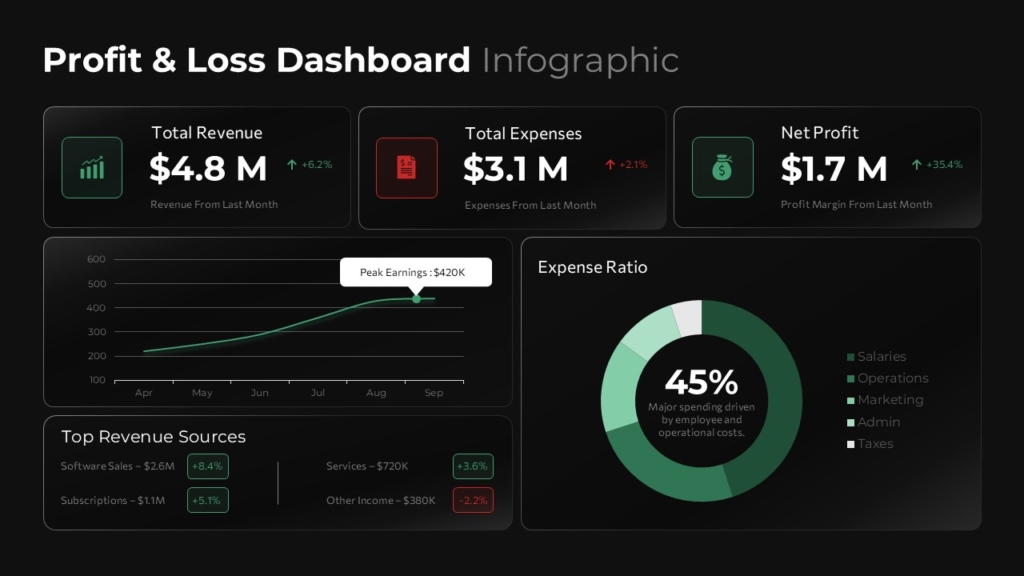
This dark-themed Profit and Loss Dashboard Infographic displays total revenue, total expenses, and net profit through prominent KPI cards. It also includes a revenue trend chart, expense ratio doughnut chart, and top revenue sources section.
Use it to: Highlight financial KPIs, present revenue and expense trends, and summarize overall profitability.
3. P&L Dashboard Template

This P&L Dashboard Template combines revenue and expense indicators, outstanding revenue, payment status, gross profit margin, net profit margin, and expense categories.
Use it to: Present monthly financial performance, monitor payment status, compare expense categories, and review profit margins.
4. Yearly Profit and Loss Presentation Template
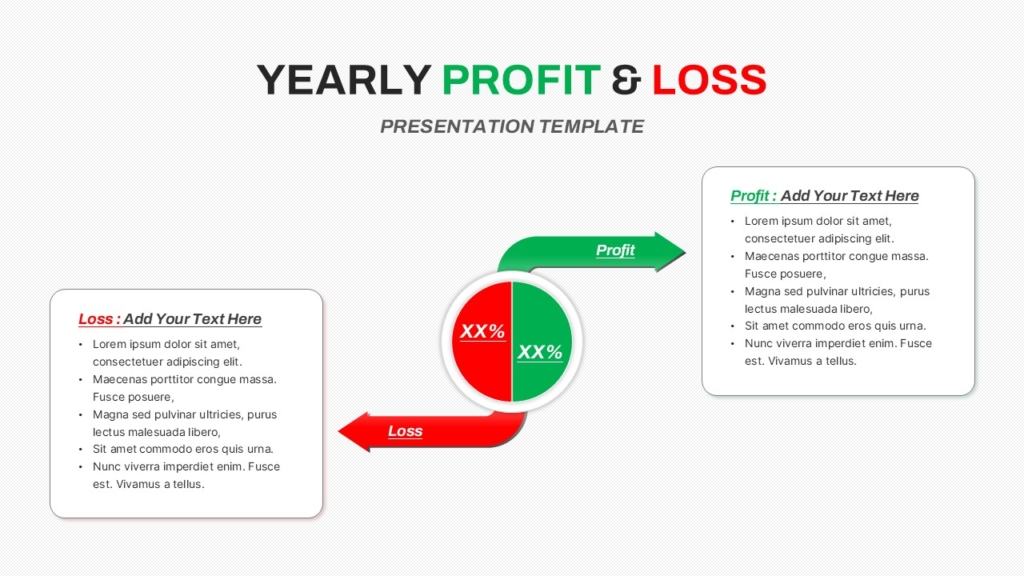
This Yearly Profit and Loss Presentation Template uses a central circular graphic to distinguish profit from loss, supported by separate content sections on both sides. The green and red visual elements make the contrast between positive and negative financial outcomes easy to understand.
Use it to: Summarize yearly profitability, explain financial gains and losses, and present annual business results.
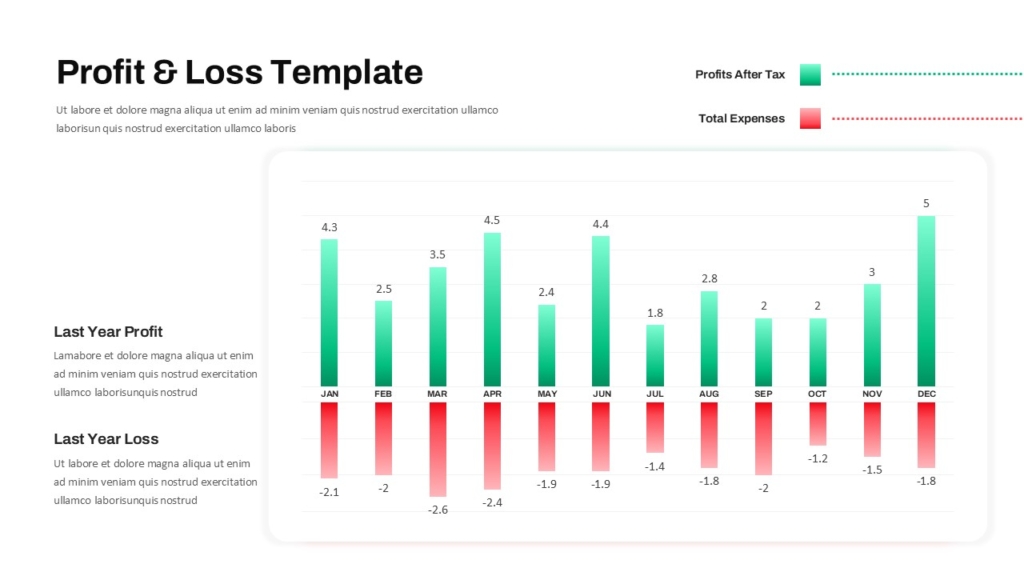
5. Monthly Profit and Loss Template
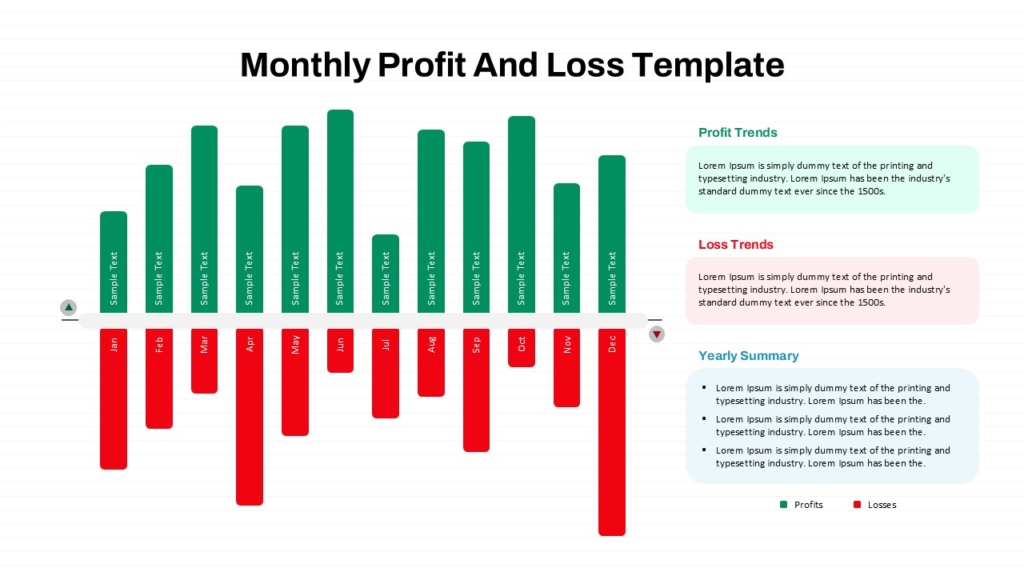
This Monthly Profit and Loss Template displays positive profit values and negative loss values using green and red vertical bars.
Use it to: Present monthly profit and loss trends, compare positive and negative results, and summarize yearly financial performance.
Conclusion
Presenting a Profit and Loss statement in PowerPoint is an effective way to communicate business performance, explain financial results, and support management decisions. By organizing revenue, expenses, and profitability into clear sections, presenters can make financial information easier to understand.
Use suitable charts, concise financial summaries, and meaningful comparisons to highlight key findings. Additionally, whether you are preparing a monthly review, quarterly report, annual financial presentation, or investor update, a well-structured P&L presentation helps transform financial figures into clear, actionable business insights.
👉Explore SlideKit PowerPoint Templates to discover financial statement layouts, P&L dashboards, monthly and yearly reporting designs, and business presentation resources. Choose a suitable template, customize it with your financial data, and present your results with clarity and confidence.