Educational Infographic Ideas for Students
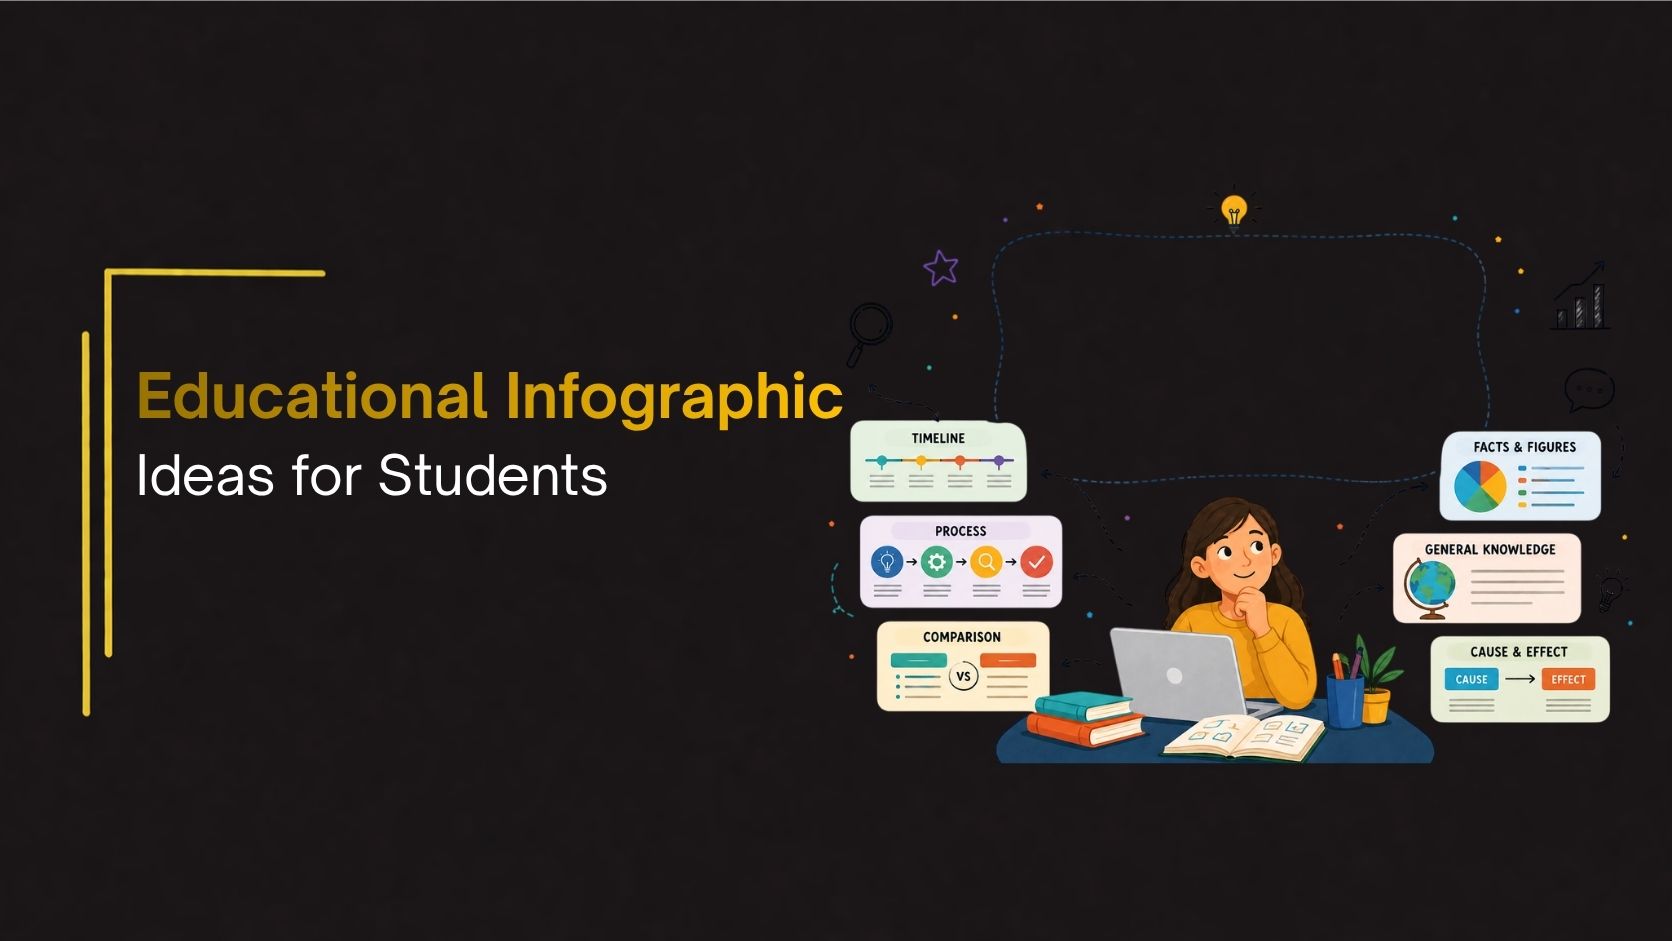
Educational infographics have become one of the most effective tools for presenting information in a visual and engaging way. Instead of relying on long paragraphs or text-heavy reports, students can transform complex topics into organized visuals that are easier to understand and remember. Infographics combine text, icons, illustrations, charts, and data into a single visual format that improves communication and audience engagement.
Whether used for classroom assignments, research projects, presentations, or educational campaigns, infographics help students explain ideas more clearly and creatively.
This guide explores educational infographic ideas that students can use for school and college projects.
Why Students Should Use Infographics
Visual learning helps audiences process information faster than large blocks of text. Educational infographics can make learning more interactive and easier to understand.
Benefits :
- Better information retention
- Simplified complex topics
- Increased audience engagement
- Improved presentation design
- Faster understanding of concepts
- More creative project delivery
Students can also develop design and communication skills by creating infographic-based presentations.
Timeline Infographic Ideas
Timeline infographics visually display events in chronological order and work well for historical topics or progress-based projects.
Examples:
- World War timeline
- Scientific discoveries timeline
- History of technology
- Company evolution timeline
- Life cycle stages
- Famous personalities timeline
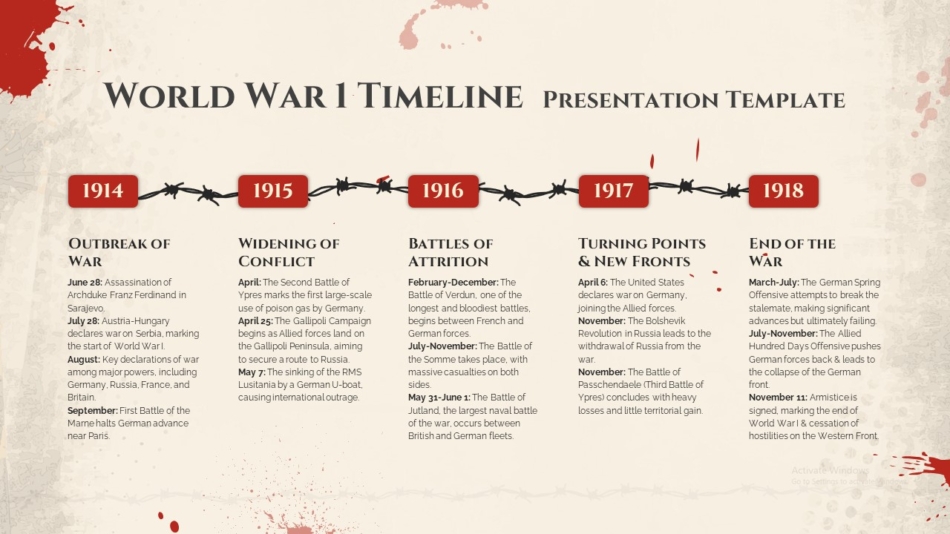
Timeline infographics help students explain developments and events in a logical sequence.
Process Infographic Ideas
Process infographics explain how something works through step-by-step visualization.
Examples:
- Water cycle process
- Plant growth process
- Human digestion system
- Product manufacturing process
- Recycling process
- Learning process flow
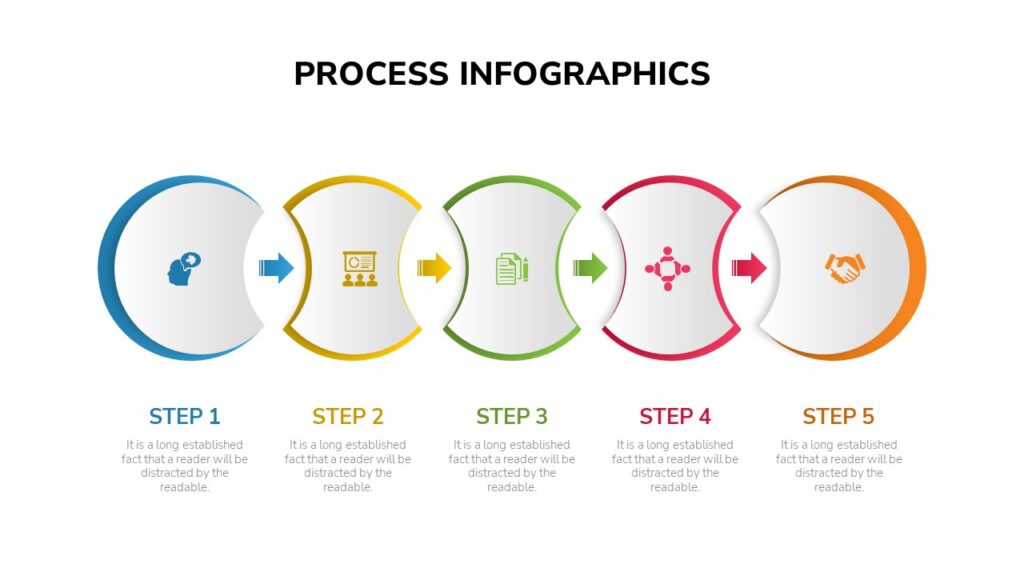
These visuals make procedures easier to understand.
Comparison Infographic Ideas
Comparison infographics show differences and similarities between two subjects.
Examples:
- Online learning vs traditional learning
- Renewable vs non-renewable energy
- Plants vs animals
- Urban life vs rural life
- Public schools vs private schools
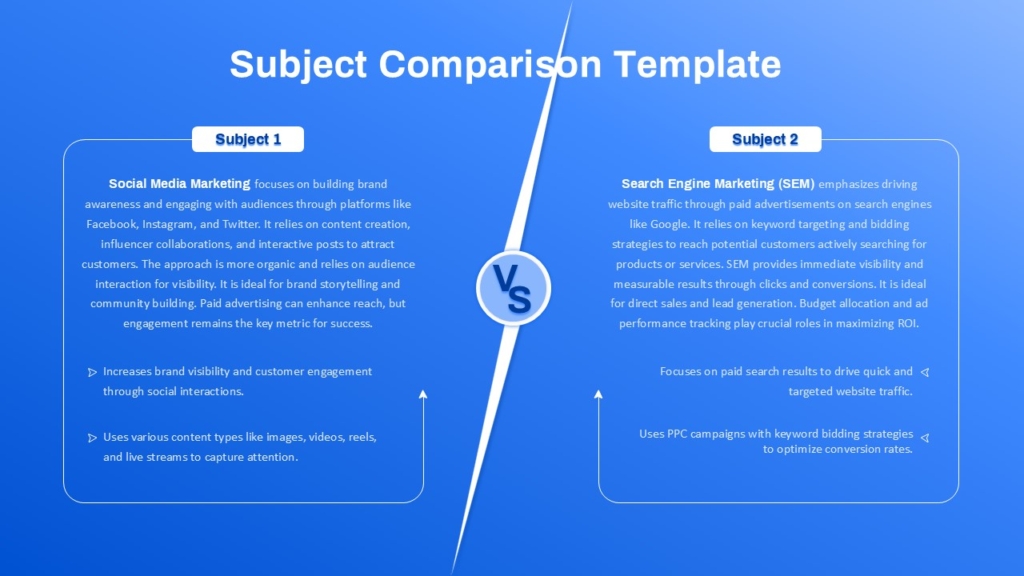
This type of infographic helps organize information clearly.
Statistical Infographic Ideas
Statistics and data-heavy subjects become easier to understand when converted into visual elements.
Examples:
- Population growth data
- Climate change statistics
- Student survey results
- Social media usage trends
- Sports performance analysis
Include:
- Bar charts
- Pie charts
- Percentage graphics
- Icons
- Numbers
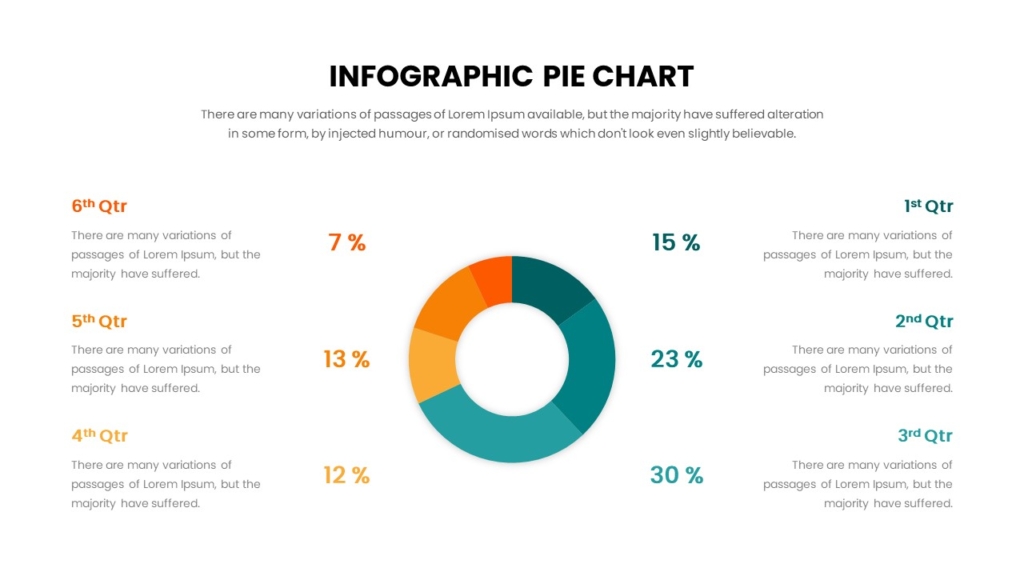
Statistical infographics simplify large datasets.
Geographic Infographic Ideas
Map-based infographics help visualize location-based information.
Examples:
- Countries and capitals
- Population distribution
- Tourist attractions
- Climate zones
- Cultural regions
- Historical events by location
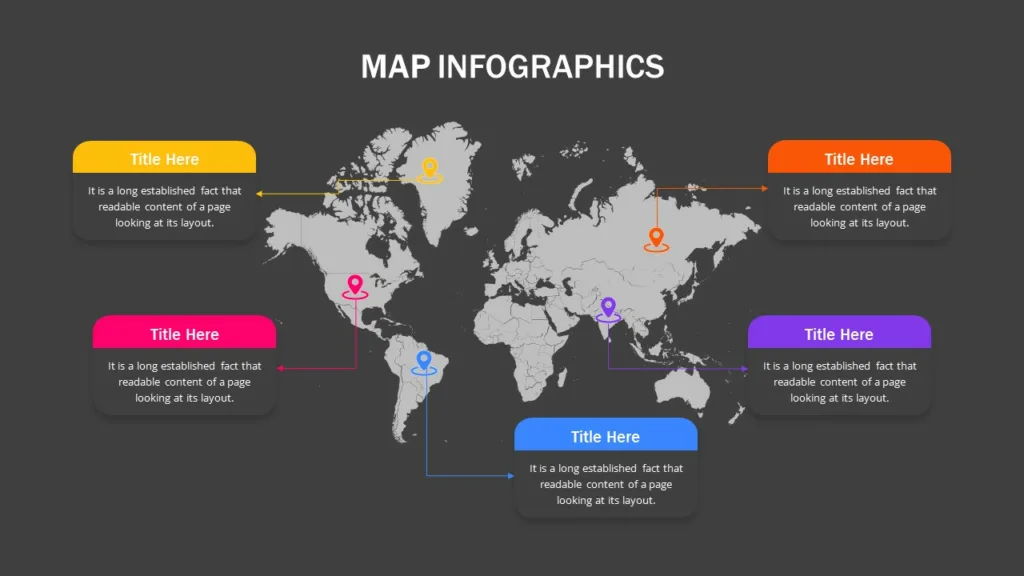
Maps improve audience understanding of geographic concepts.
Hierarchy Infographic Ideas
Hierarchy infographics show levels, structures, and relationships.
Examples:
- Food chain diagrams
- Organization charts
- Government structure
- Family tree projects
- Ecosystem levels
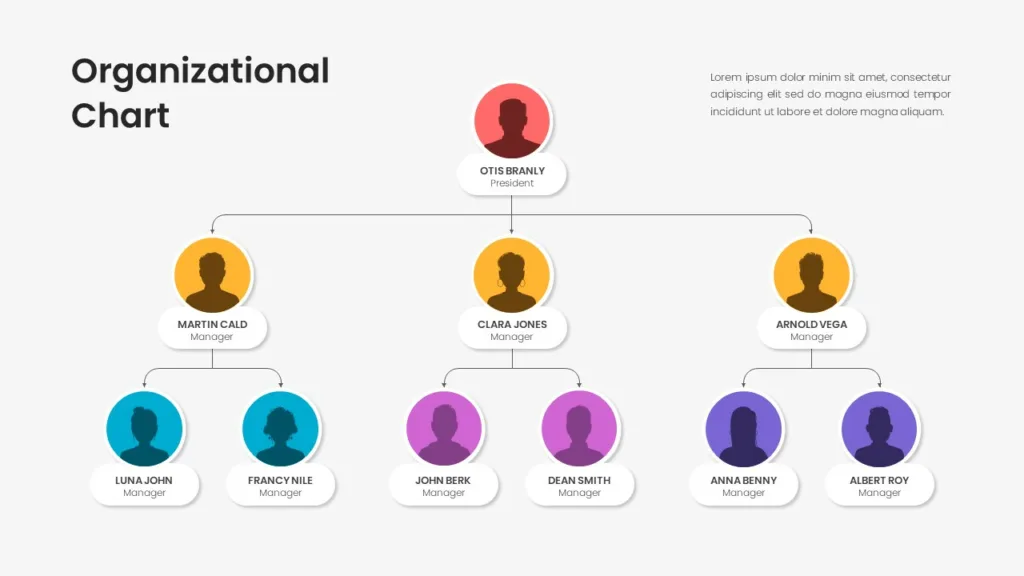
Students can use hierarchy visuals for educational and science subjects.
List-Based Infographic Ideas
List infographics organize information into quick and digestible sections.
Examples:
- Top 10 inventions
- Five healthy habits
- Seven continents facts
- Ten study techniques
- Reading recommendations
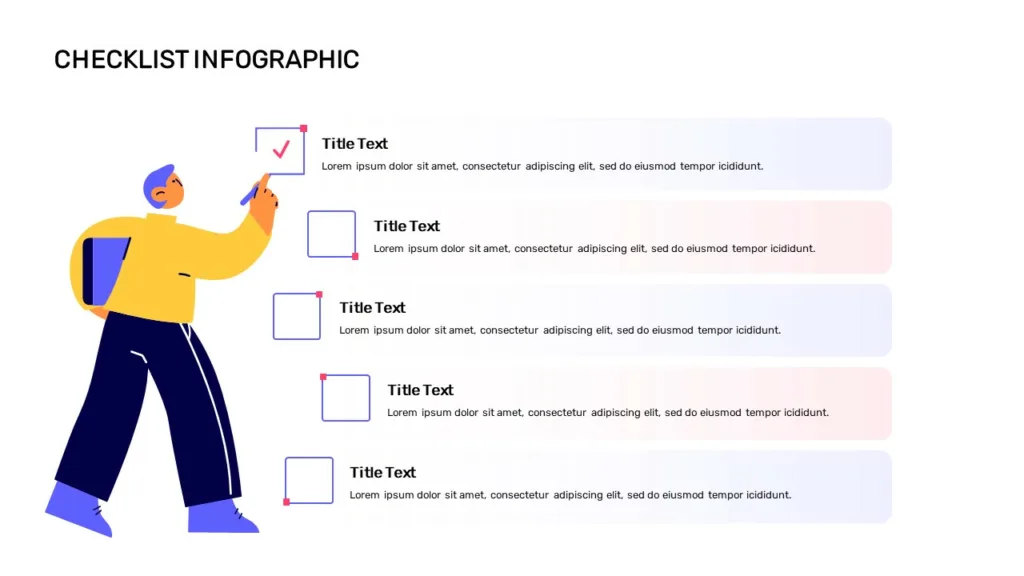
This format works well for quick learning content.
Key Mistakes Students Must Avoid
- Adding too much text : Large paragraphs reduce visual appeal.
- Using too many colors : Too many colors create distractions.
- Ignoring alignment : Poor spacing makes infographics look unprofessional.
- Using low-quality visuals : Blurred graphics reduce presentation quality.
- Overcomplicating information : Keep concepts easy to understand.
Conclusion
Educational infographics help students transform information into visually engaging content that improves understanding and presentation quality. From timelines and comparisons to statistics and process diagrams, choosing the right infographic type can make school projects and presentations more impactful.
Instead of designing layouts from scratch, students can save time with ready-made infographic designs.
👉Explore SlideKit for professionally designed infographic templates for PowerPoint and Google Slides that help create visually engaging educational presentations faster and more effectively.