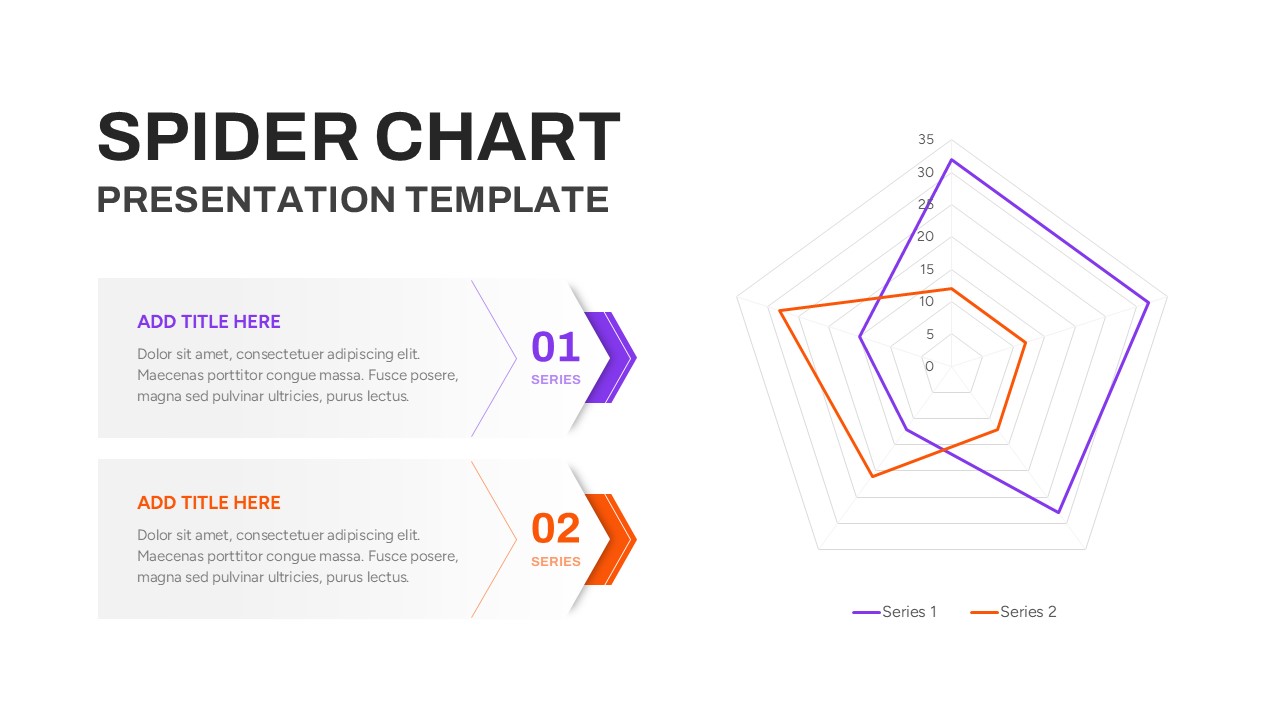
Editable Spider Chart Template For PowerPoint

This template is part of a deck featuring multiple slides. To check out all slides, click on See All. See All round right arrow

The Spider Chart PowerPoint Template is a powerful visual tool for comparing data across multiple variables. Featuring a clean and modern design, this template is perfect for showcasing performance metrics, market analysis, skill evaluations, or strategic comparisons. The spider (or radar) chart format allows users to plot multiple series of data on a single chart, making it easier to identify strengths, weaknesses, and trends.

This template includes designated sections for adding descriptive text alongside the chart, ensuring your audience understands the context and implications of the data. The vibrant color-coded lines and customizable labels enhance clarity and make the presentation visually engaging. Fully compatible with PowerPoint and Google Slides, this template is easy to edit, allowing you to modify colors, values, and text to suit your specific needs.

Whether you’re presenting business KPIs, evaluating team performance, or comparing product features, this spider chart template ensures your message is delivered with precision and impact. It’s ideal for professionals in marketing, business strategy, HR, and education.

See more