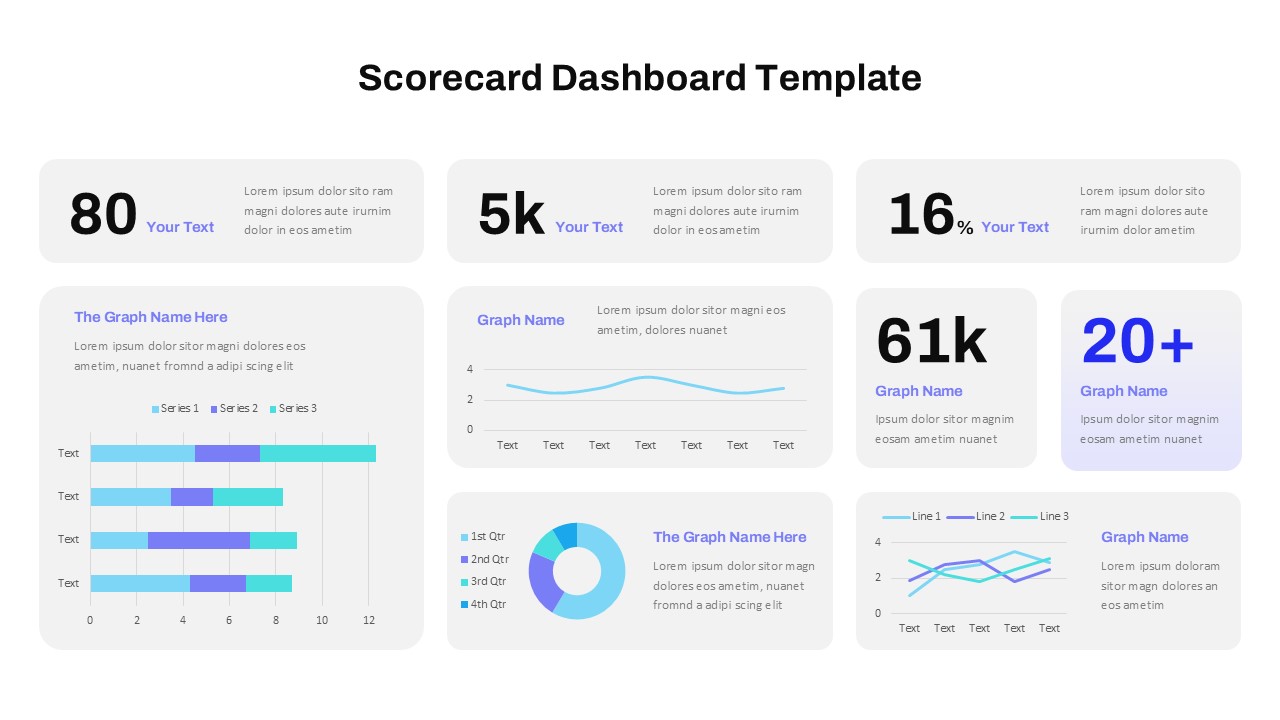
Editable Scorecard Dashboard PowerPoint Template

Elevate your data presentation with this Scorecard Dashboard PowerPoint Template, designed to display key metrics and performance indicators in a clear and organized layout. This template is perfect for creating data-driven presentations, offering various sections for numerical values, percentages, and graphical representations such as bar charts, line graphs, and pie charts. Ideal for business managers, data analysts, and project leaders, this template enables you to present complex information with ease, helping your audience quickly grasp important metrics and trends.
Each slide in this Scorecard Dashboard is fully customizable, allowing you to adjust colors, labels, and data values to match your specific reporting needs. Use it to showcase quarterly performance, financial metrics, marketing KPIs, or operational efficiency statistics. With individual data cards for each metric and sections for comprehensive charts, this template is highly versatile and well-suited for monthly or quarterly reviews, sales performance updates, and executive summaries. It’s also a valuable tool for team meetings where data transparency and clarity are essential.
Compatible with both PowerPoint and Google Slides, this template ensures a seamless experience for any presentation platform. This Scorecard Dashboard template is an essential asset for anyone looking to create professional, impactful presentations that emphasize key data points and insights.
See more


