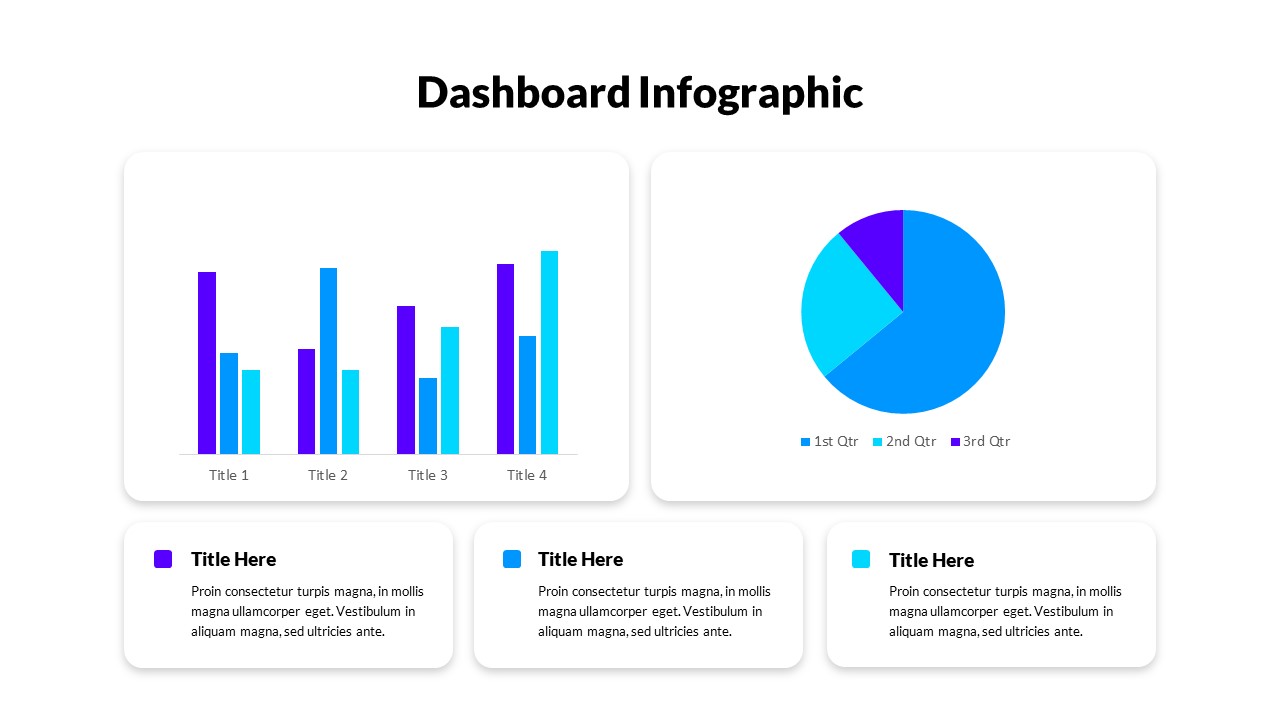
Powerpoint Presentation Dashboard Template

This template is part of a deck featuring multiple slides. To check out all slides, click on See All. See All round right arrow

Showing KPIs in an easily understandable way is best for statistical reports. So, our dashboard presentation with a bar chart and pie diagram template supports your data presentation in a simple and precise manner. In addition, it has a wide range of uses beyond business and finance presentations. For example, researchers can use it as an academic dashboard slide for showing inferences in editable graphs.Powerpoint dashboard combines a blue color chart with black and white background. The presenters can enter their written statements in the square boxes beneath. Try out simple graphs, charts, and diagrams for  powerpoint and google slides presentations with the help of this template. Get these attractive and fully customizable slides now!

See more