
Types of Infographics Explained: Examples and Best Uses
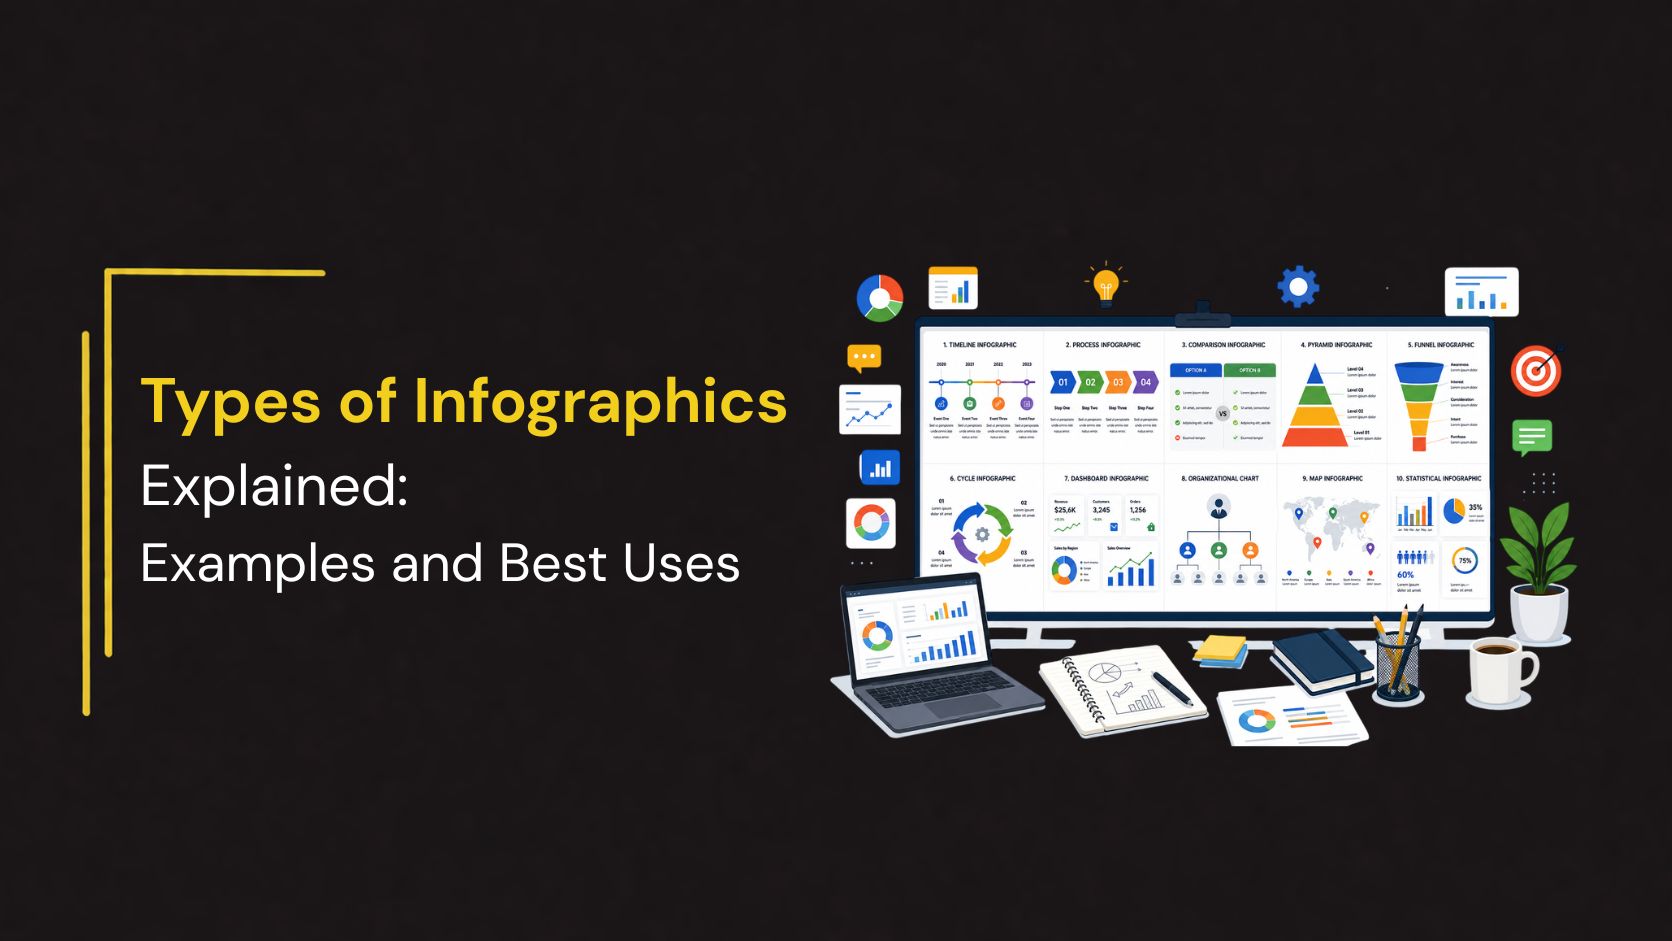
Infographics have become one of the most powerful ways to communicate information. Instead of presenting lengthy paragraphs or complex spreadsheets, infographics combine visuals, icons, charts, and concise text to make information easier to understand. Whether you’re explaining a business strategy, presenting research findings, comparing products, or teaching a concept, the right infographic can significantly improve audience engagement and comprehension.
Different infographic styles are designed for different purposes. Choosing the right one helps you present your message more effectively and ensures your audience quickly understands the information being shared.
In this guide, we’ll explore the most common types of infographics, their practical applications, and examples of when to use each one in your presentations.
What Is an Infographic?
An infographic is a visual representation of information that combines text, graphics, icons, illustrations, and charts to communicate ideas clearly and efficiently. Rather than relying on paragraphs of text, infographics organize content into visually appealing sections that are easy to scan and understand.
Businesses, educators, marketers, healthcare professionals, and consultants use infographics to simplify complex topics, present data, and tell compelling visual stories.
Why Use Infographics in Presentations?
Infographics make presentations more engaging by transforming information into clear visual formats. They help audiences process information faster and improve retention by presenting key points in an organized and visually appealing way.
Benefits :
- Improve audience engagement
- Support visual storytelling
- Highlight important insights
- Make reports easier to understand
- Improve presentation flow
Whether you’re speaking to executives, clients, students, or stakeholders, infographics help communicate your message with greater impact.
1. Timeline Infographic
A timeline infographic presents events in chronological order, making it ideal for showing progress, milestones, or historical developments.
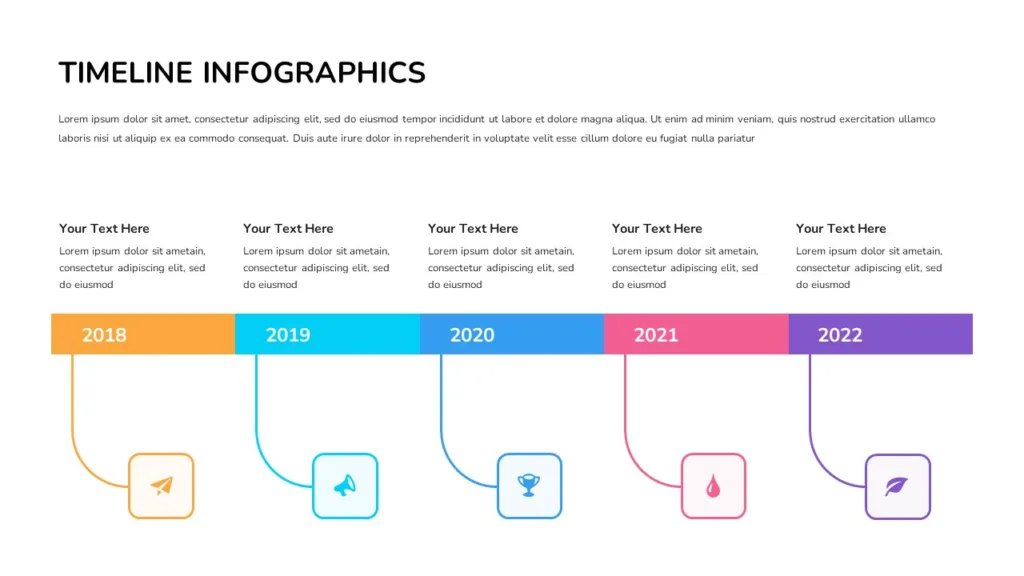
Best uses : Company history, Project milestones, Historical events, Product launch schedules, Learning journeys
2. Process Infographics
Process infographics explain how something works through a sequence of connected steps.
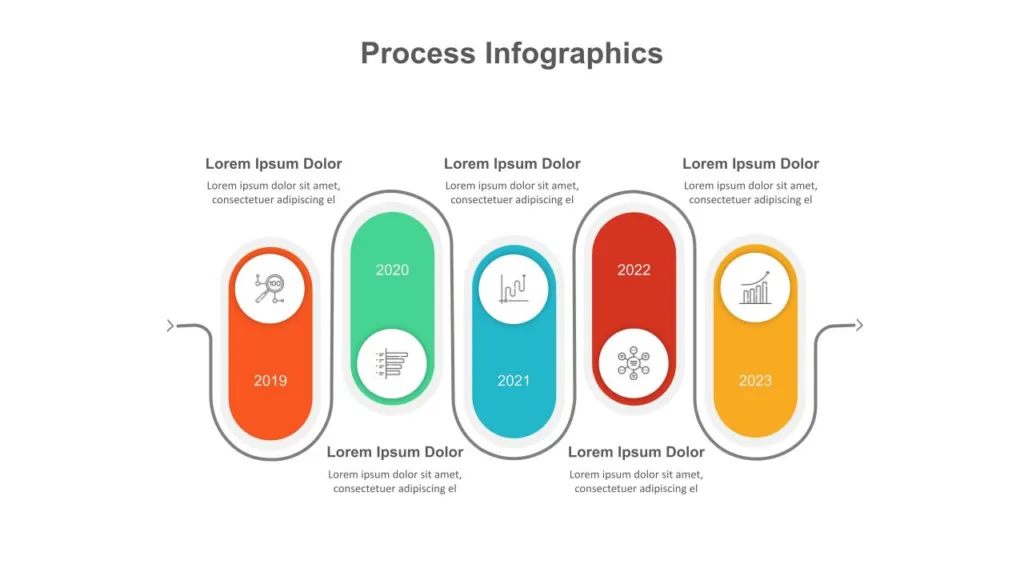
Best uses : Business workflows, Employee onboarding, Manufacturing processes, Customer support procedures.
3. Comparison Infographic
Comparison infographics help audiences evaluate two or more options side by side.
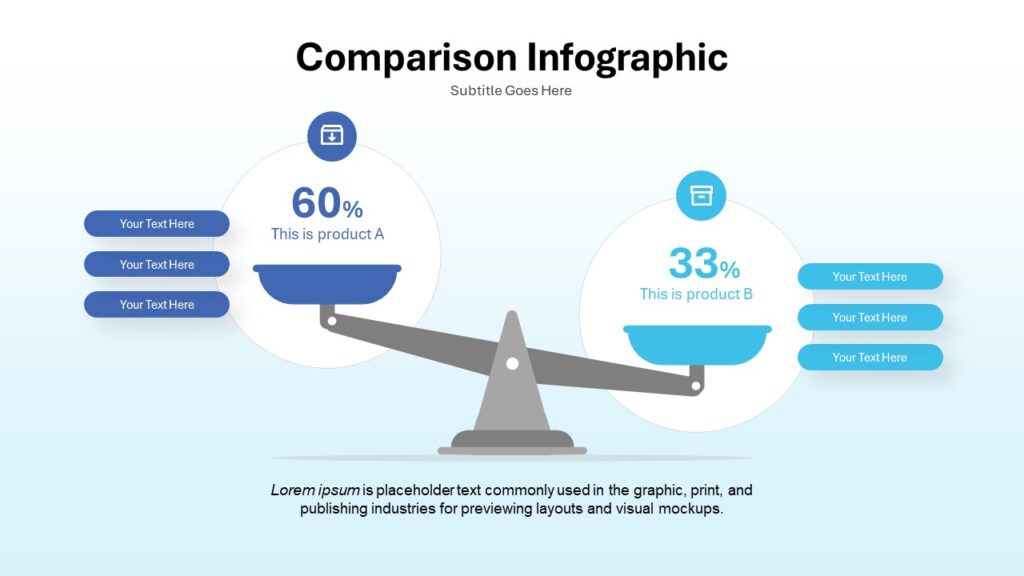
Best uses : Product comparisons, Competitor analysis, Service plans, feature comparisons.
4. Funnel Infographic
Funnel infographics visualize how users move through different stages of a process while narrowing toward a final goal.
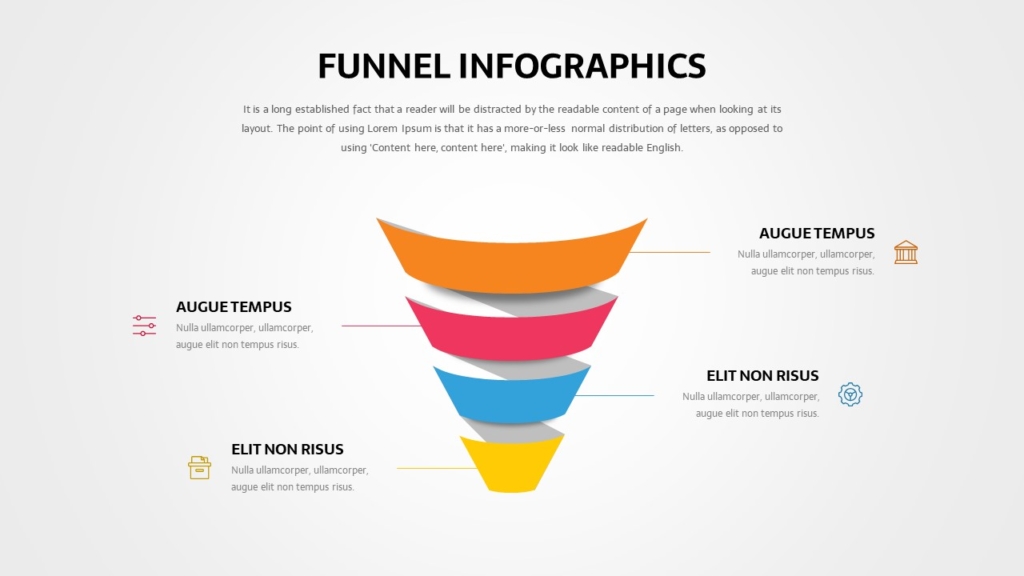
Best Uses : Sales funnels, Marketing campaigns, Recruitment processes, Lead generation.
5. Cycle Infographic
Cycle infographics illustrate continuous or repeating processes without a defined beginning or end.
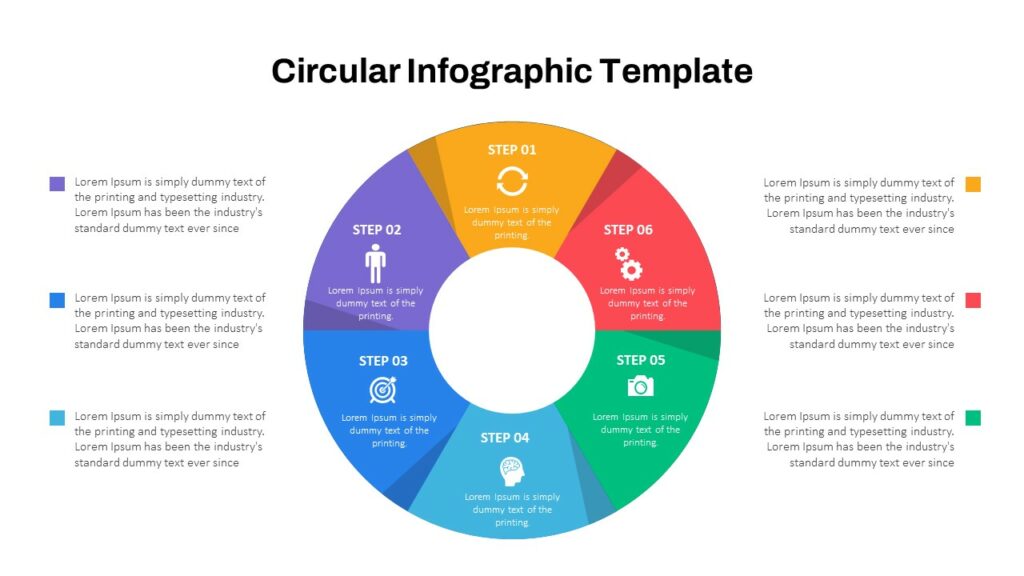
Best uses : Product lifecycle, Continuous improvement, Customer retention, Agile workflows.
6. Geographic infographics
Geographic infographics use maps to present location-based information.
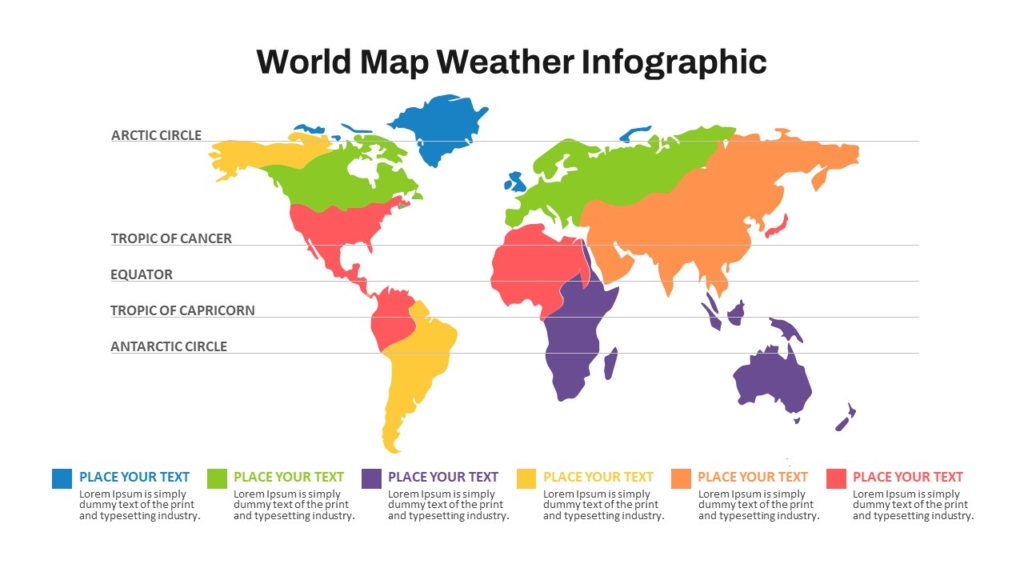
Best uses : Market expansion, Regional sales, Demographics, Global operations
7. List Infographic
List infographics organize information into numbered or categorized sections for quick reading.
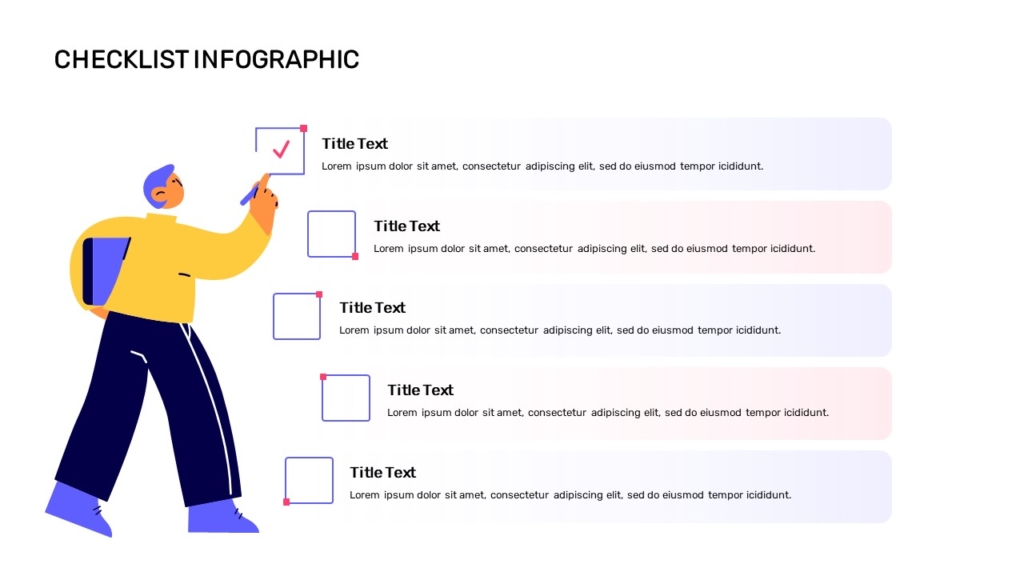
Best uses : Market expansion, Regional sales, Demographics, Global operations
8. Dashboard Infographic
Dashboard infographics combine KPIs, charts, and metrics into a single visual overview.
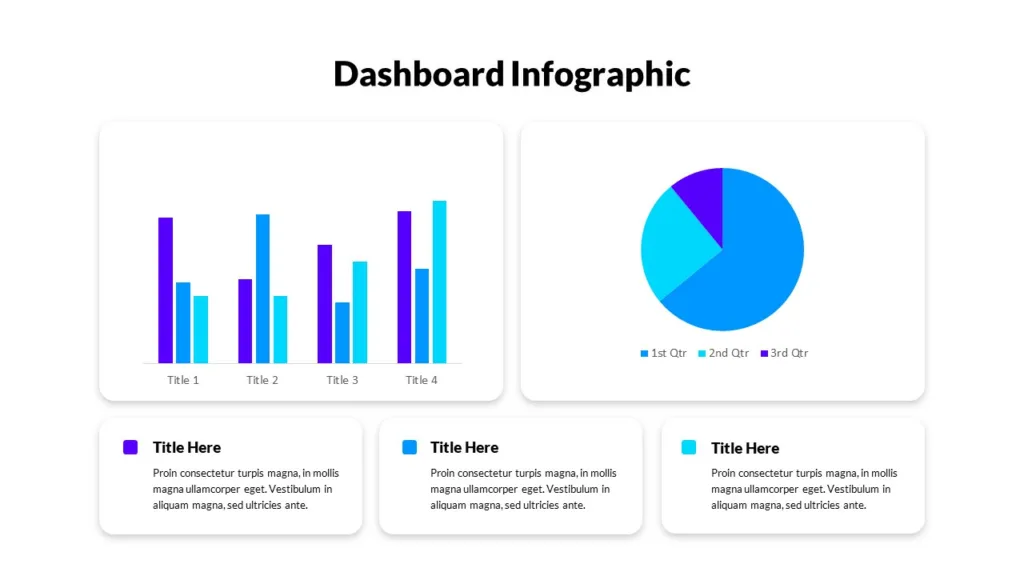
Best uses : Executive reporting, Sales dashboards, Financial reporting, Marketing performance
9. Matrix Infographic
Matrix infographics compare multiple variables across a structured grid.
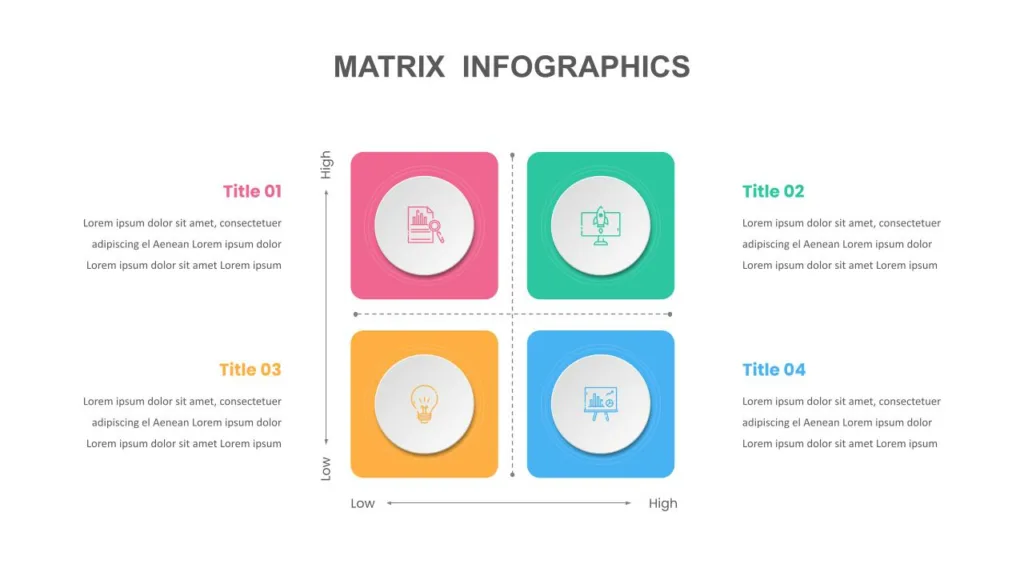
Best uses : Risk assessment, Decision-making, Product evaluation, Strategic planning
Conclusion
Infographics are powerful communication tools that make complex information easier to understand through visual storytelling. Whether you’re presenting a timeline, process, comparison, dashboard, funnel, or organizational chart, choosing the right infographic type helps your audience absorb information more quickly and retain key insights. By combining thoughtful design with the appropriate visual format, you can create presentations that are both informative and engaging.
To build professional infographic presentations with ease, explore SlideKit’s Infographic PowerPoint and Google Slides Templates. SlideKit offers a wide range of fully editable infographic layouts, including timelines, process diagrams, comparison charts, funnels, pyramids, dashboards, organizational charts, and more. With modern, customizable designs, you can transform your ideas into visually compelling presentations that leave a lasting impression.