Build a PowerPoint Bubble Chart in Minutes
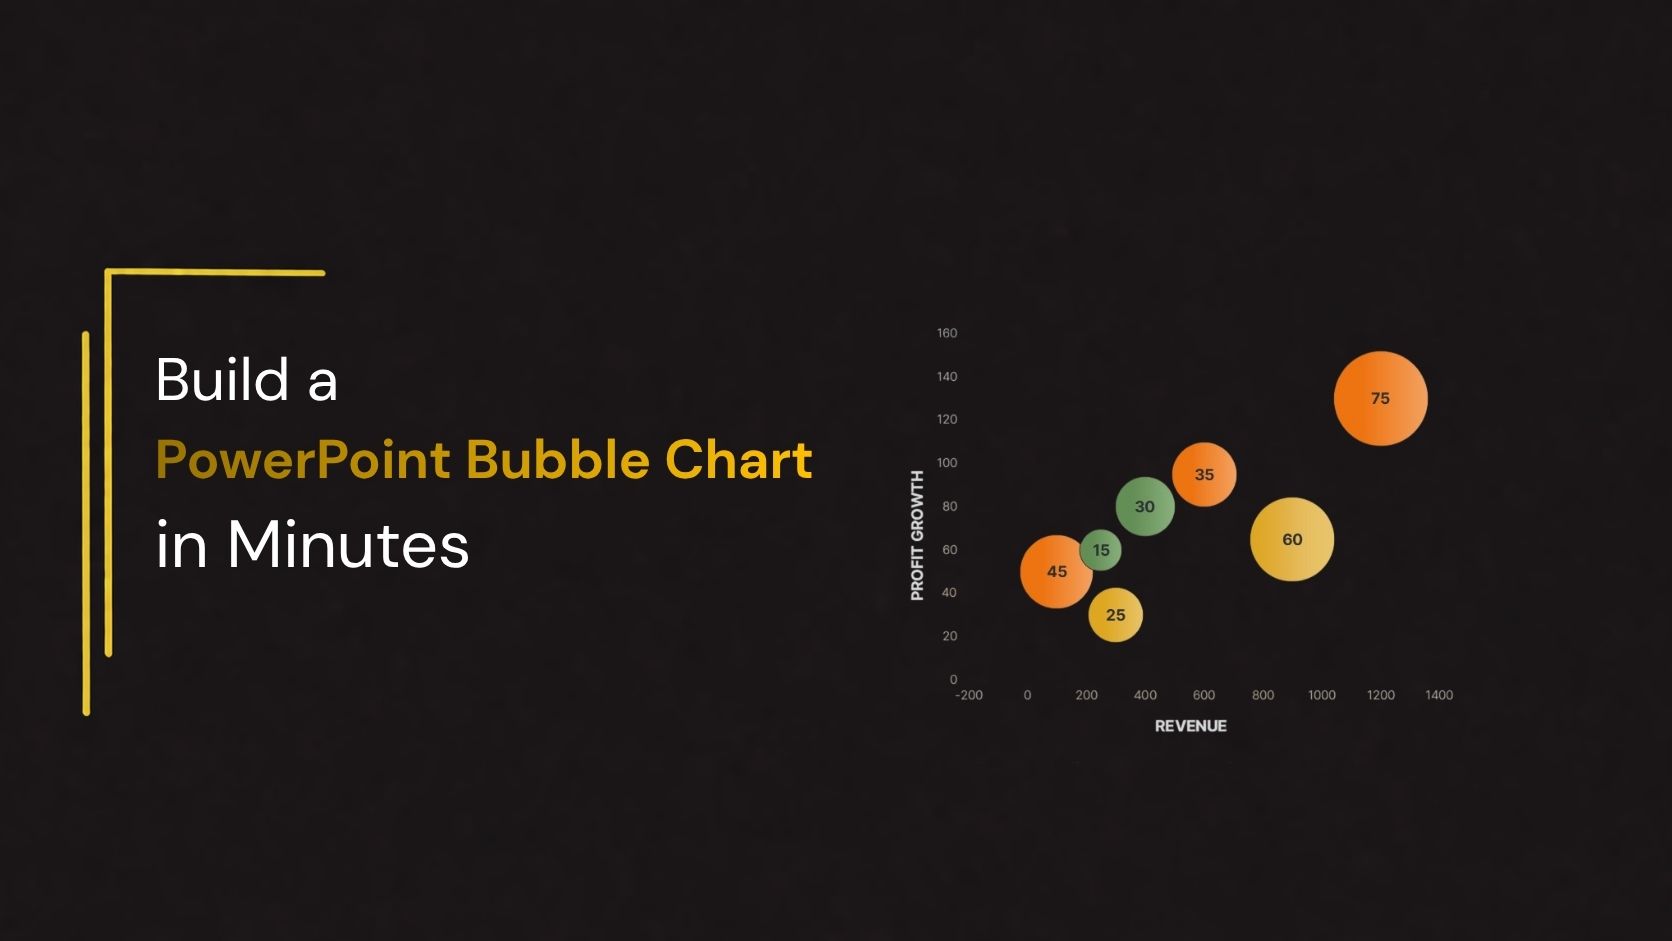
Presenting complex data does not always require multiple charts or lengthy explanations. Sometimes, a single visual can help your audience understand several data points at once. A PowerPoint bubble chart is one such visualization tool that allows you to compare three different data values in a clear and engaging format.
Whether you are preparing a business presentation, market analysis, sales report, financial review, or project update, a bubble chart can help turn numerical information into meaningful insights. By combining horizontal position, vertical position, and bubble size, you can communicate relationships and differences between data points more effectively.
The good news is that you do not need advanced design skills to create one. With PowerPoint’s built-in chart tools, you can build a bubble chart in just a few minutes. In this guide, you will learn how to prepare your data, create a bubble chart in PowerPoint, customize its appearance, and use it effectively in your presentations.
What Is a Bubble Chart in PowerPoint?
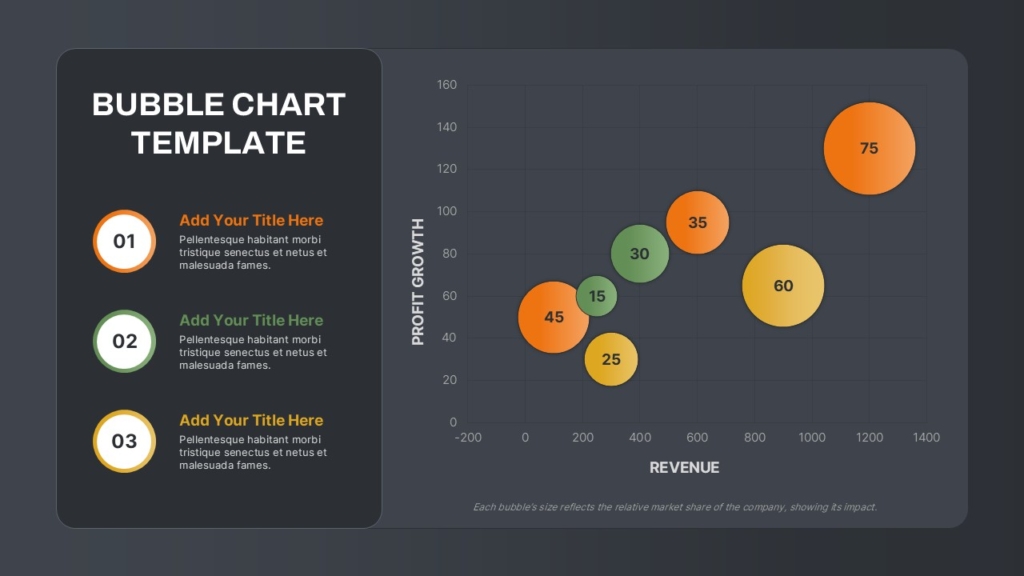
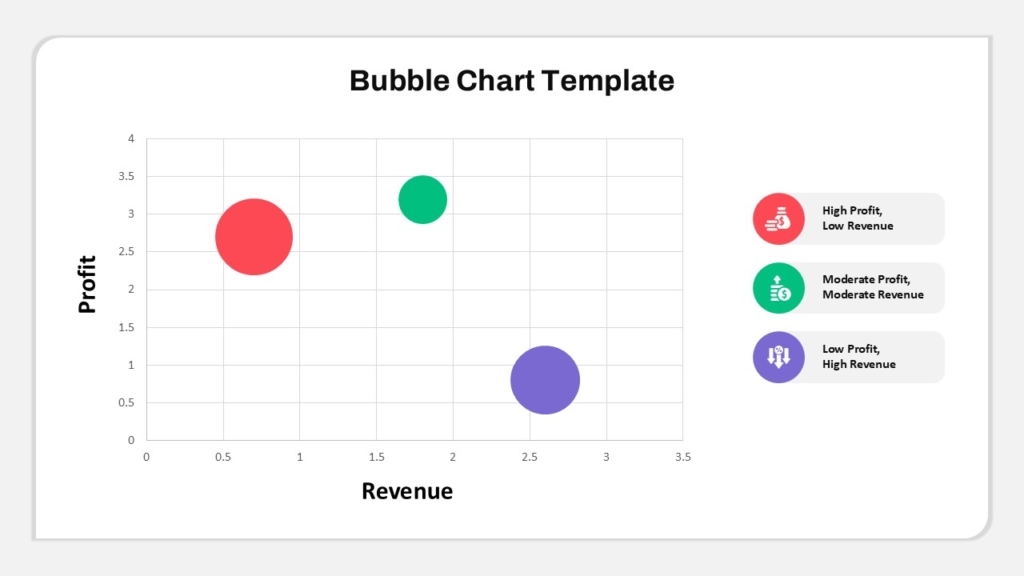
A bubble chart is a type of data visualization that uses circles, or bubbles, to represent individual data points. Similar to a scatter chart, it uses horizontal and vertical axes to display two numerical values. However, it also introduces a third variable through the size of each bubble.
In a PowerPoint bubble chart:
- X-axis: Represents the first numerical variable.
- Y-axis: Represents the second numerical variable.
- Bubble size: Represents the third numerical variable.
Why Use a Bubble Chart in Your Presentation?
A well-designed bubble chart can make data-heavy presentations easier to understand. Instead of presenting multiple rows of figures, you can use different bubble sizes and positions to communicate important information.
Here are some reasons to use a bubble chart in PowerPoint:
1. Compare Three Variables at Once
A bubble chart displays three numerical variables in one visual. Therefore, it is useful when you need to compare multiple factors, such as revenue, growth rate, and market share.
2. Identify Patterns and Relationships
The position of bubbles can reveal relationships between two variables. Additionally, differences in bubble sizes help highlight the third variable, making it easier to identify important patterns.
3. Highlight Important Data Points
Larger bubbles naturally attract attention. You can use this feature to emphasize high-performing products, major markets, important projects, or other significant values.
4. Simplify Complex Business Data
Bubble charts present numerical information in a compact format. Consequently, they can help business professionals, analysts, and decision-makers understand complex comparisons more quickly.
5. Improve Presentation Engagement
Visual representations are often easier to follow than lengthy tables. By using a bubble chart, you can make your PowerPoint slides more engaging while keeping the information organized.
How to Create a Bubble Chart in PowerPoint
Creating a bubble chart in PowerPoint is a simple way to compare three numerical variables in one visual. You can use the built-in chart feature to plot data, adjust bubble sizes, and customize the design to match your presentation.
Follow these steps to create a professional PowerPoint bubble chart.
Step 1: Prepare Your Data
Before inserting the chart, organize your data into three numerical columns. Each column represents a different variable:
- X-axis: Represents the first variable, such as revenue.
- Y-axis: Represents the second variable, such as profit growth.
- Bubble Size: Represents the third variable, such as market share.
Step 2: Insert a Bubble Chart
- Open your PowerPoint presentation and select the slide where you want to add the chart.
- Click the Insert tab on the ribbon.
- Select Chart to open the chart selection window.
- Choose X Y (Scatter) from the chart categories.
- Select Bubble or 3-D Bubble.
- Click OK to insert the chart.
PowerPoint will add a sample bubble chart to your slide and open an embedded Excel worksheet for entering data.
Step 3: Enter Your Data
Replace the sample values in the Excel worksheet with your prepared data.
- Enter the X-axis values in the first data column.
- Add the Y-axis values in the second data column.
- Enter the bubble size values in the third data column.
- Keep each product or category in its corresponding row.
As you update the worksheet, PowerPoint automatically adjusts the bubble positions and sizes. Once all values are entered, close the worksheet to return to your slide.
Step 4: Adjust the Bubble Sizes
Select the chart and open the formatting options to adjust the appearance of the bubbles.
- Right-click a bubble or the data series.
- Select Format Data Series.
- Locate the bubble size scaling option, if available in your PowerPoint version.
- Adjust the scale until the bubbles are easy to compare.
- Check that larger bubbles do not hide smaller data points.
Choose a balanced size range so the chart remains readable.
Step 5: Customize Bubble Colors
Use different colors to distinguish products, categories, or business segments.
- Select the bubble or data series you want to format.
- Open the Format Data Series or Format Data Point panel.
- Choose Fill & Line.
- Select a suitable fill color.
- Adjust the outline and transparency if needed.
- Repeat for other categories or data points.
Use a consistent color palette that complements your presentation. Avoid too many colors, as they can make the chart difficult to interpret.
Step 6: Add a Chart Title and Axis Labels
Clear labels help your audience understand what the chart represents.
- Select the bubble chart.
- Click the Chart Elements (+) button, if available.
- Enable Chart Title and Axis Titles.
- Replace the default chart title with a meaningful heading.
- Label the horizontal and vertical axes.
Step 7: Add Data Labels
Data labels help viewers identify individual products or categories.
- Select the chart.
- Open Chart Elements (+).
- Enable Data Labels.
- Right-click a label and choose Format Data Labels.
- Select the information you want to display, such as values or category names, depending on the available options.
Keep labels short and readable. If the chart becomes crowded, label only the most important data points.
Step 8: Add Supporting Information
Use the space around the chart to explain important findings. You can add short text sections, numbered callouts, or key takeaways.
Step 9: Review and Finalize the Chart
Before presenting, check the chart for accuracy and readability.
- Verify that all numerical values are correct.
- Confirm that bubble sizes represent the intended third variable.
- Check the axis labels and chart title.
- Make sure bubbles and labels do not overlap unnecessarily.
- Use readable fonts and sufficient color contrast.
- Align the chart and supporting text within the slide.
Create Professional Data Visualization Slides with SlideKit
Building a bubble chart in PowerPoint is a simple way to make complex data easier to understand. By combining three numerical variables in one visual, you can highlight relationships, compare performance, and communicate important findings more effectively.
However, a professional presentation requires more than just accurate data. The layout, typography, colors, labels, and supporting elements also influence how your audience understands the information.
To save time on slide design, explore the collection of PowerPoint templates from SlideKit. You can find professionally designed presentation resources for business reports, financial analysis, marketing presentations, dashboards, and other data-driven topics.
Choose a suitable layout, customize the content, and present your data with greater clarity and confidence.