
8 Business Concepts That Work Better as Diagrams

Business presentations often involve complex ideas, relationships, processes, and strategies. Explaining these concepts through long paragraphs or bullet points can make them difficult for an audience to follow. A well-designed diagram can simplify the information and help viewers understand the main idea faster.
Diagrams turn abstract business concepts into visual structures. They show how different elements connect, where a process begins and ends, how decisions are made, and how different parts of a business work together.
Whether you are preparing a strategy presentation, business plan, marketing deck, project proposal, or management report, choosing the right diagram can make your message clearer and more memorable.
Here are 8 business concepts that often work better as diagrams.
1. Business Model
A business model explains how a company creates, delivers, and captures value. Presenting every component in a paragraph can quickly become complicated.
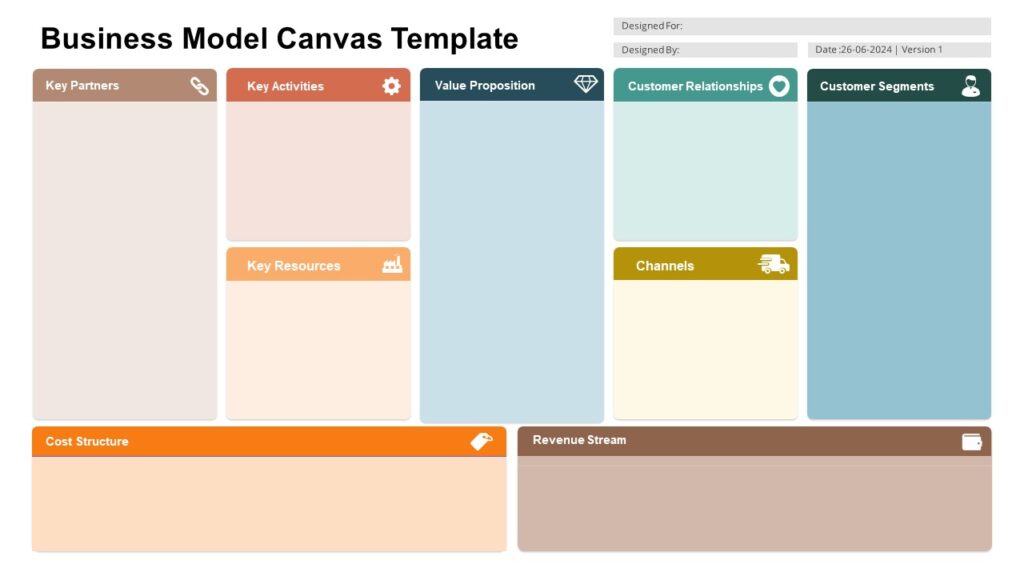
A Business Model Canvas or similar visual framework can organize the idea into clear sections, such as:
- Customer segments
- Value propositions
- Key activities
- Key resources
- Customer relationships
- Channels
- Revenue streams
- Cost structure
- Key partnerships
Best for : Business plans, startup presentations, strategy meetings, and investor discussions.
2. Business Process
Business processes often involve several steps, departments, and decisions. A written explanation may describe the process, but a diagram shows the sequence immediately.
A flowchart can represent each stage from start to finish, while arrows show how information, tasks, or decisions move through the process.
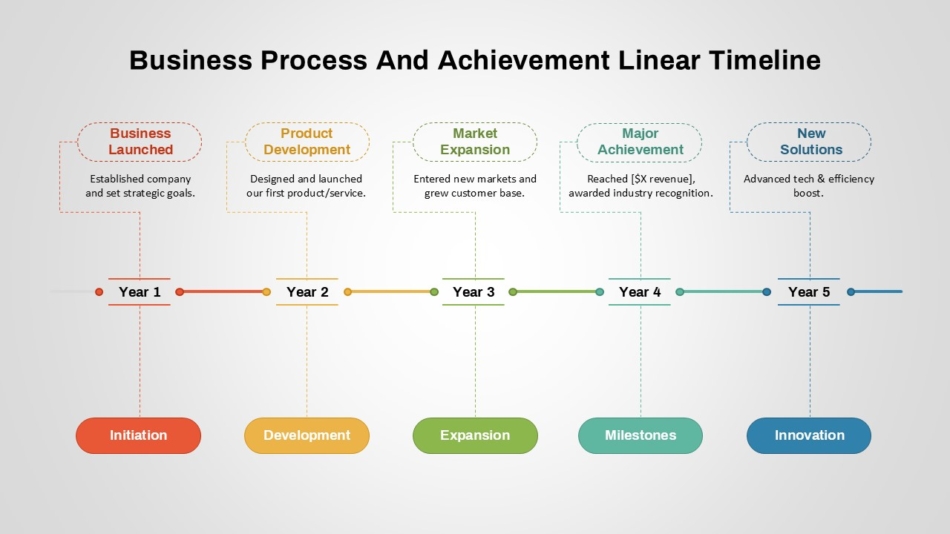
This structure makes bottlenecks and unnecessary steps easier to identify.
Best for: Operations, process improvement, training, and workflow presentations.
3. Customer Journey
The customer journey includes multiple interactions between a customer and a business. These interactions can span marketing, sales, customer service, and retention.
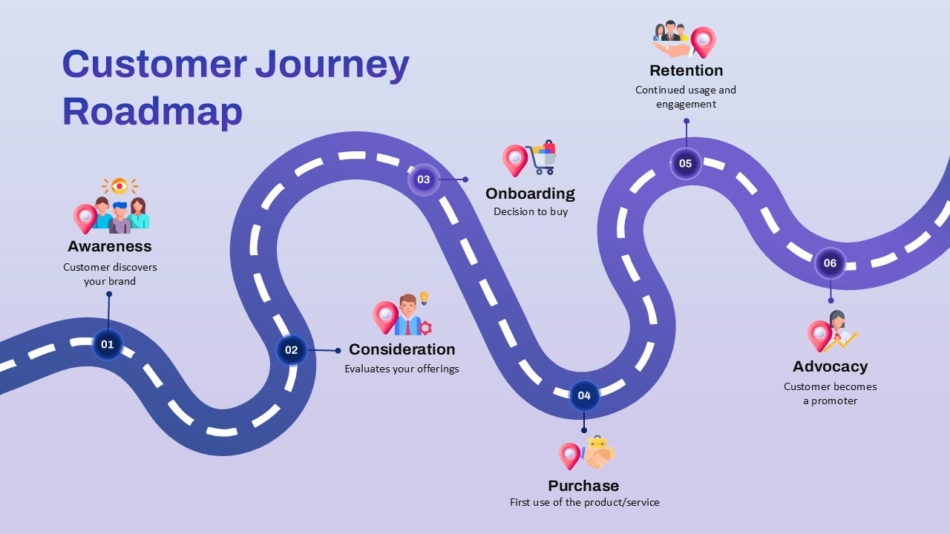
A Customer Journey Map provides a visual view of the experience across different stages, such as:
Awareness → Consideration → Purchase → Onboarding → Support → Loyalty
This helps teams understand the customer experience from the customer’s perspective rather than viewing individual interactions separately.
Best for: Marketing strategy, customer experience, product development, and service design.
4. Organizational Structure
Explaining who reports to whom becomes difficult when an organization has multiple departments and management levels.
An Organizational Chart provides a simple visual representation of company structure. It can show leadership, managers, teams, departments, and reporting relationships.
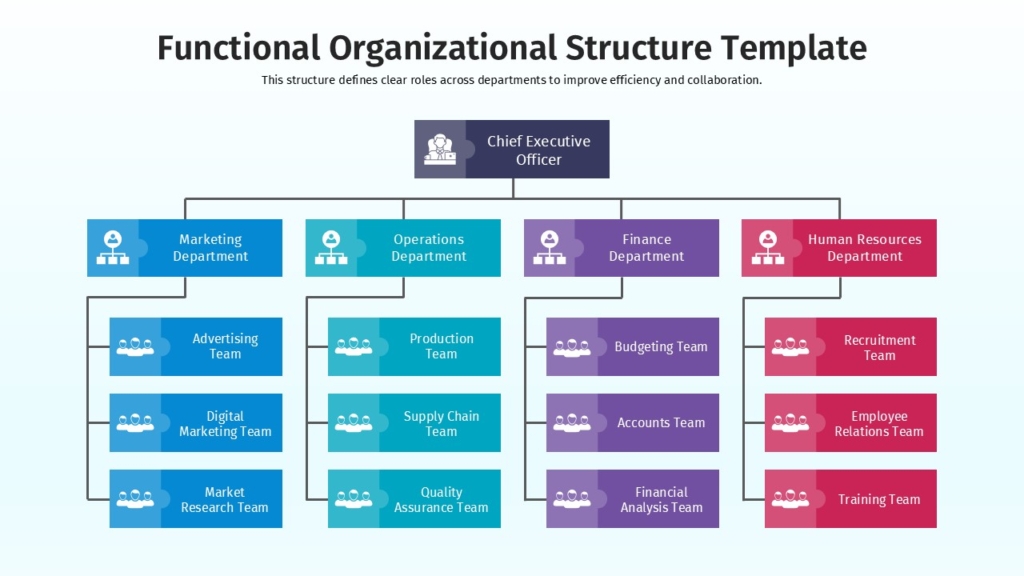
CEO → Department Heads → Managers → Team Members
A visual hierarchy helps employees and stakeholders understand responsibilities and reporting lines quickly.
Best for: HR presentations, company introductions, onboarding, restructuring, and management meetings.
5. Sales Funnel
The sales process involves moving prospects through different stages before they become customers. A diagram makes this progression much easier to understand.
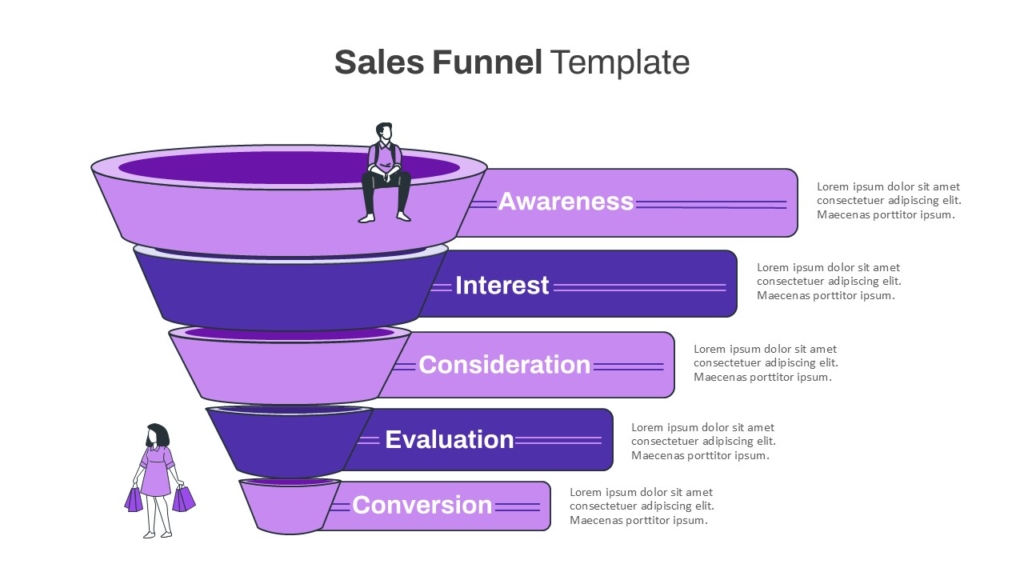
Teams can add conversion rates, sales targets, or KPIs to each stage to make the diagram more useful for performance discussions.
Best for: Sales strategy, marketing presentations, revenue planning, and performance reviews.
6. Risk Management
Risk management involves understanding potential threats, their causes, controls, and consequences. A list of risks may provide information, but it does not always explain the relationship between these elements.
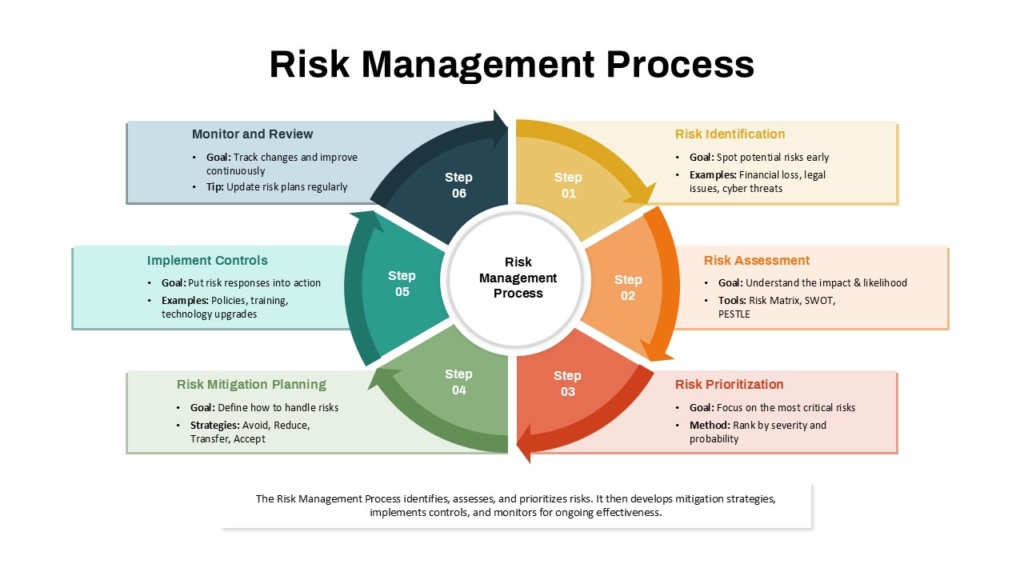
Best for: Risk management, cybersecurity, safety, compliance, ESG, and operational planning.
7. Decision-Making
Business decisions often depend on multiple conditions or possible outcomes. Explaining every possibility in text can make the decision process confusing.
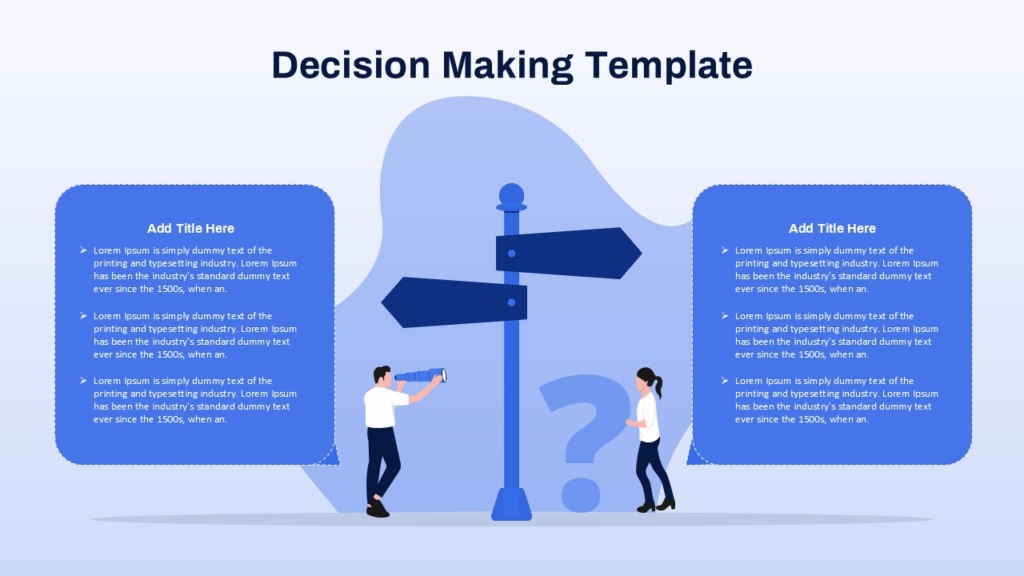
Decision trees help teams understand the consequences of different choices and create a structured approach to complex decisions.
Best for: Strategic decisions, product launches, investment planning, operations, and risk analysis.
8. Competitive Positioning
Understanding how a company compares with competitors requires more than listing strengths and weaknesses. A visual framework can help audiences see market positioning at a glance.
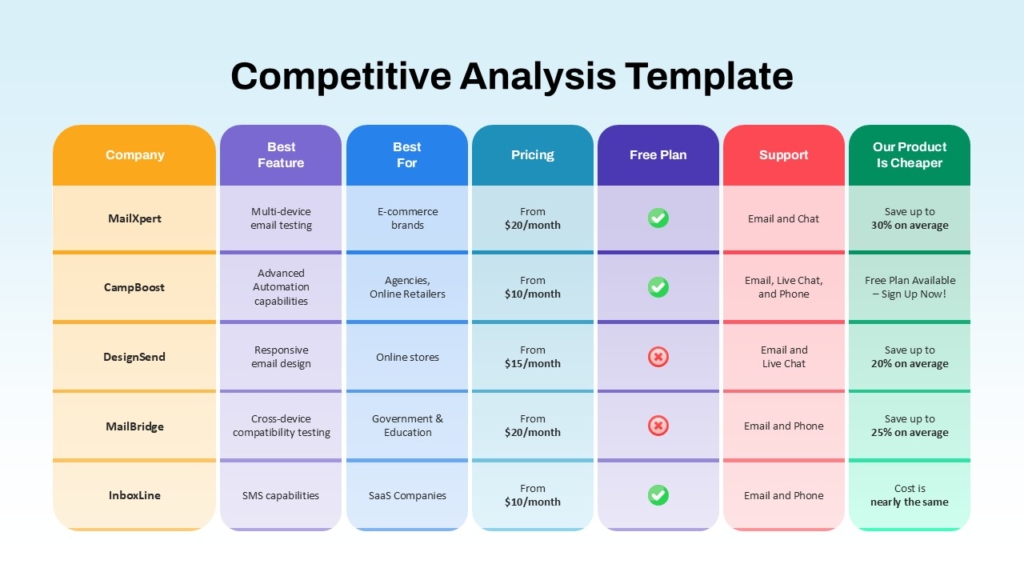
Companies and competitors can then be positioned on the map to highlight market gaps and areas of differentiation.
This can help teams identify opportunities and communicate positioning more effectively.
Best for: Marketing strategy, competitive analysis, product positioning, and market research.
Why Use Diagrams for Business Concepts?
Diagrams are effective because they reduce the amount of information an audience needs to process at once. Instead of reading several paragraphs, viewers can recognize relationships, sequences, categories, and priorities visually.
1. They simplify complex information
A diagram can organize multiple ideas into one structured visual. This is particularly useful when presenting processes, strategies, or organizational relationships.
2. They improve audience understanding
Visual relationships can make abstract concepts easier to understand. Arrows, shapes, levels, and positioning help communicate how different elements relate to one another.
3. They make presentations more engaging
Slides filled with text can quickly lose an audience’s attention. Diagrams introduce visual structure while keeping the presentation focused.
4. They support faster decision-making
When information is organized visually, decision-makers can compare options, identify gaps, and recognize priorities more quickly.
5. They improve information retention
A clear visual structure can help audiences remember the main concept after the presentation ends.
Turn Complex Business Ideas Into Clear Visuals
Many business concepts become easier to explain when audiences can see how the pieces fit together. From business models and customer journeys to sales funnels, risk frameworks, strategy maps, and decision trees, diagrams provide a structured way to communicate complex information.
The key is not to add more visuals simply to make a presentation look attractive. Instead, choose a diagram that matches the relationship you need to explain.
With the right visual framework, a complicated business concept can often become a single clear, memorable slide.
👉Explore SlideKit’s collection of editable PowerPoint and Google Slides templates to turn business concepts, strategies, processes, and data into professional visual presentations.