
Global Oil And Gas Pipeline Network Map Template for PowerPoint
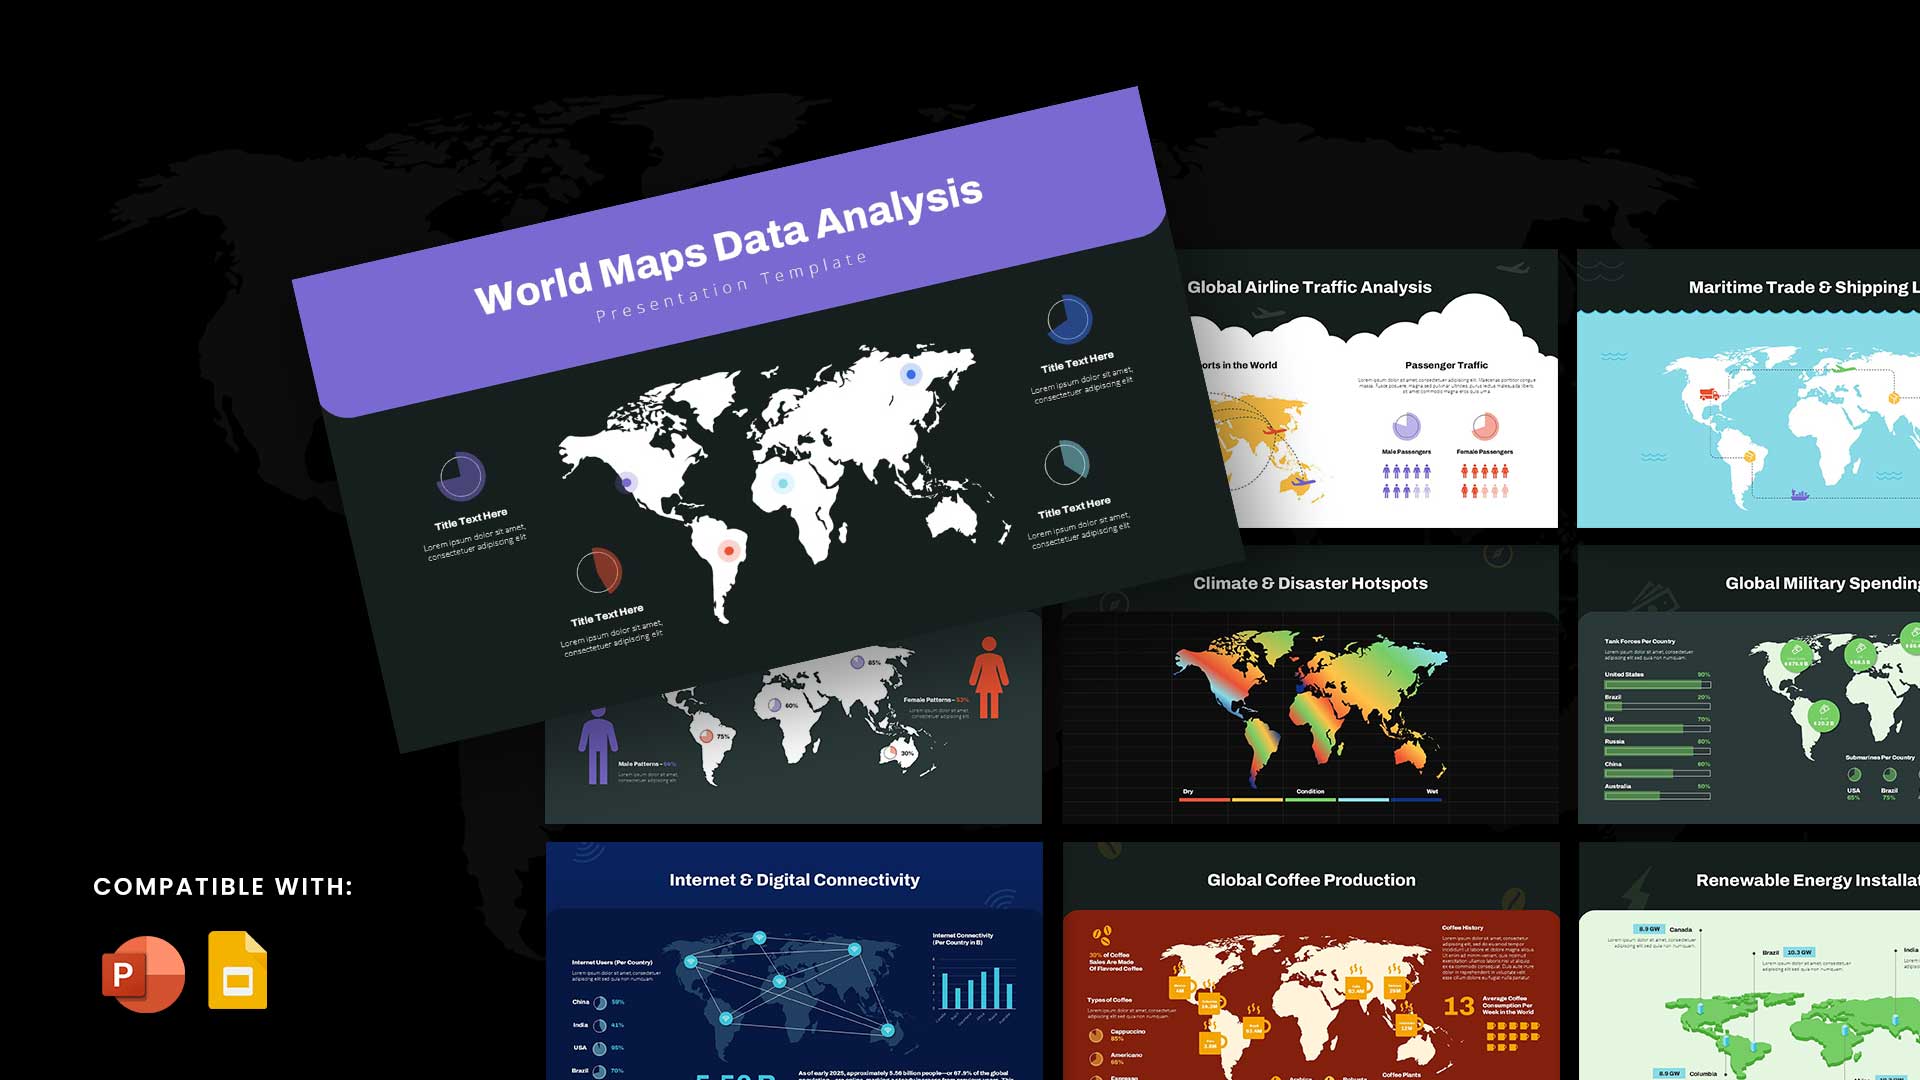
This template is part of a deck featuring multiple slides. To check out all slides, click on See All.
See All


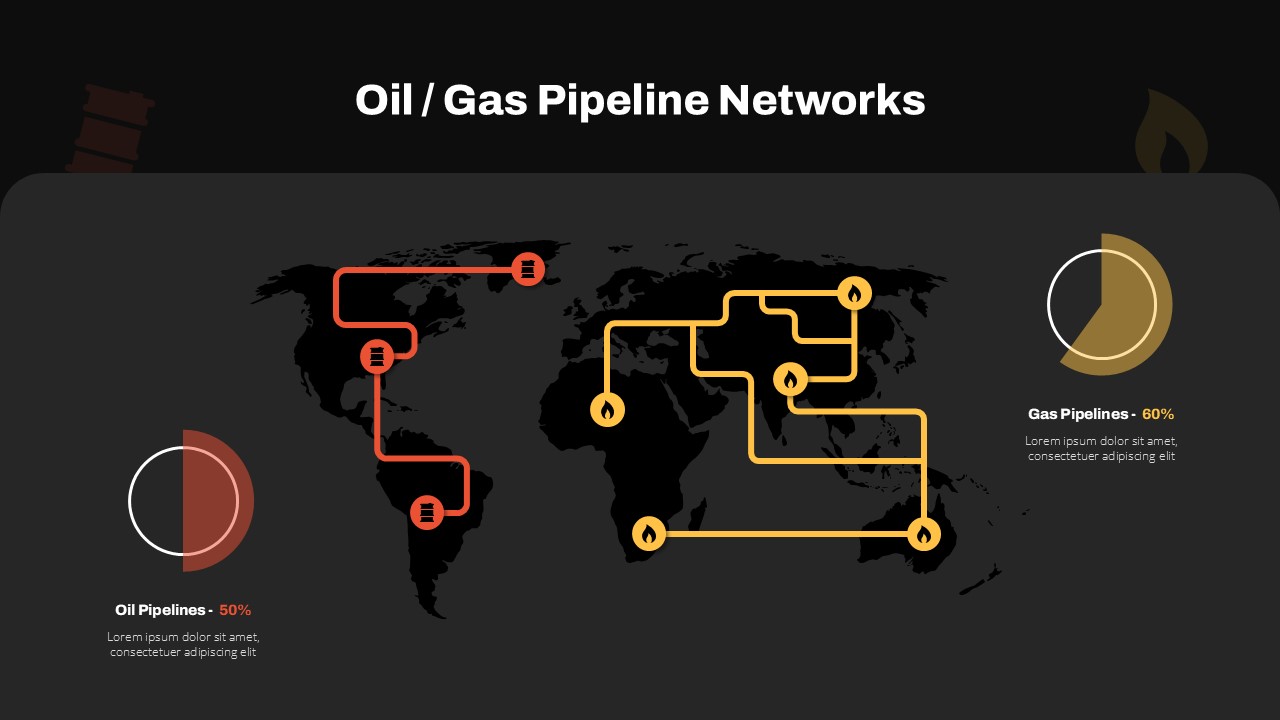
A dark-themed world map slide titled “Oil / Gas Pipeline Networks,” displaying global pipeline routes in red (oil) and yellow (gas). Includes icons and pie charts showing 50% oil and 60% gas pipeline distribution. Ideal for energy, infrastructure, and geopolitics presentations.