Global Coffee Production Presentation Template
This template is part of a deck featuring multiple slides. To check out all slides, click on See All.
See All


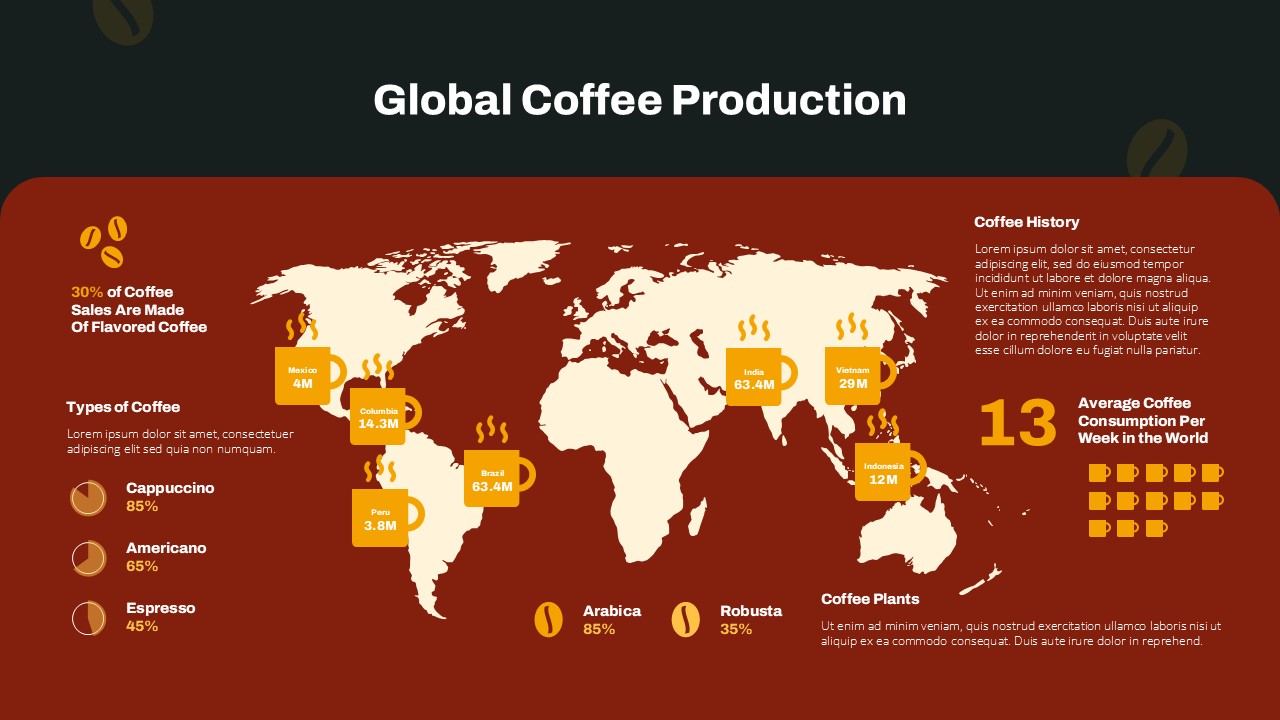
A red-toned slide titled “Global Coffee Production” featuring a world map with coffee output stats (e.g., Brazil & India: 63.4M). Includes icons for Arabica and Robusta types, data on flavored coffee sales, coffee type popularity, and an average of 13 cups consumed per week globally.

