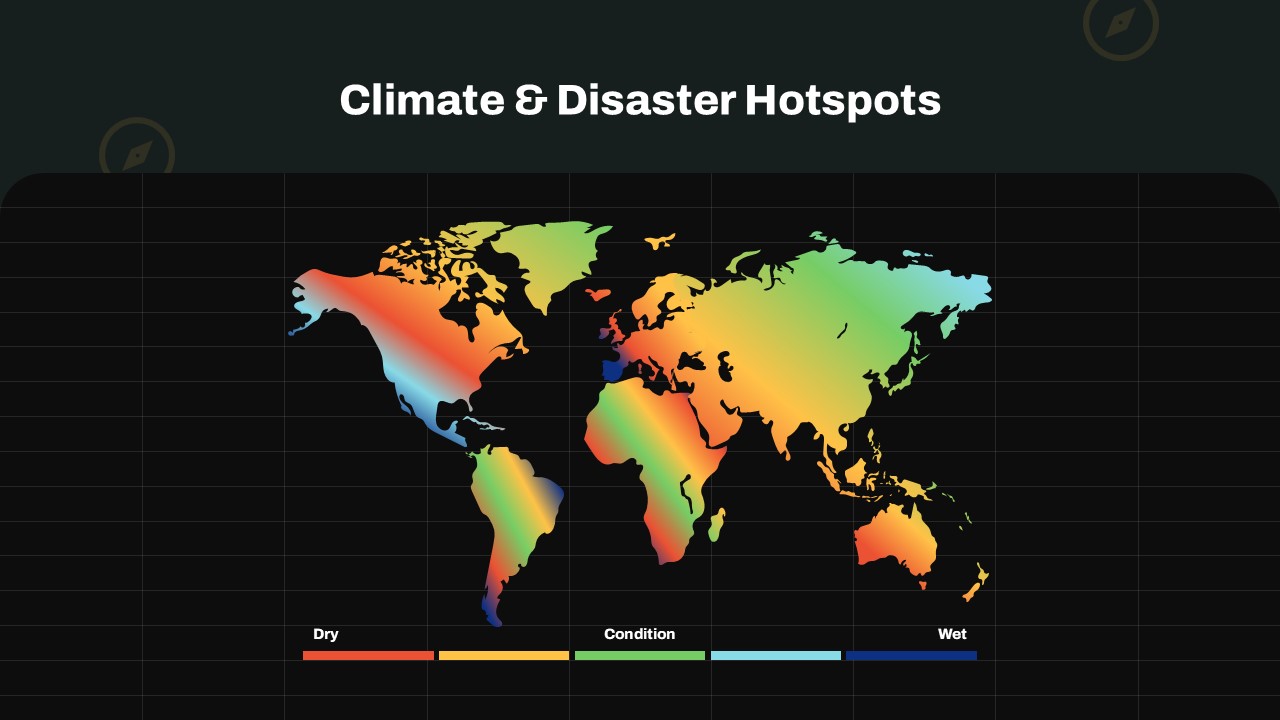
Climate And Disaster Hotspots In World Map Slide
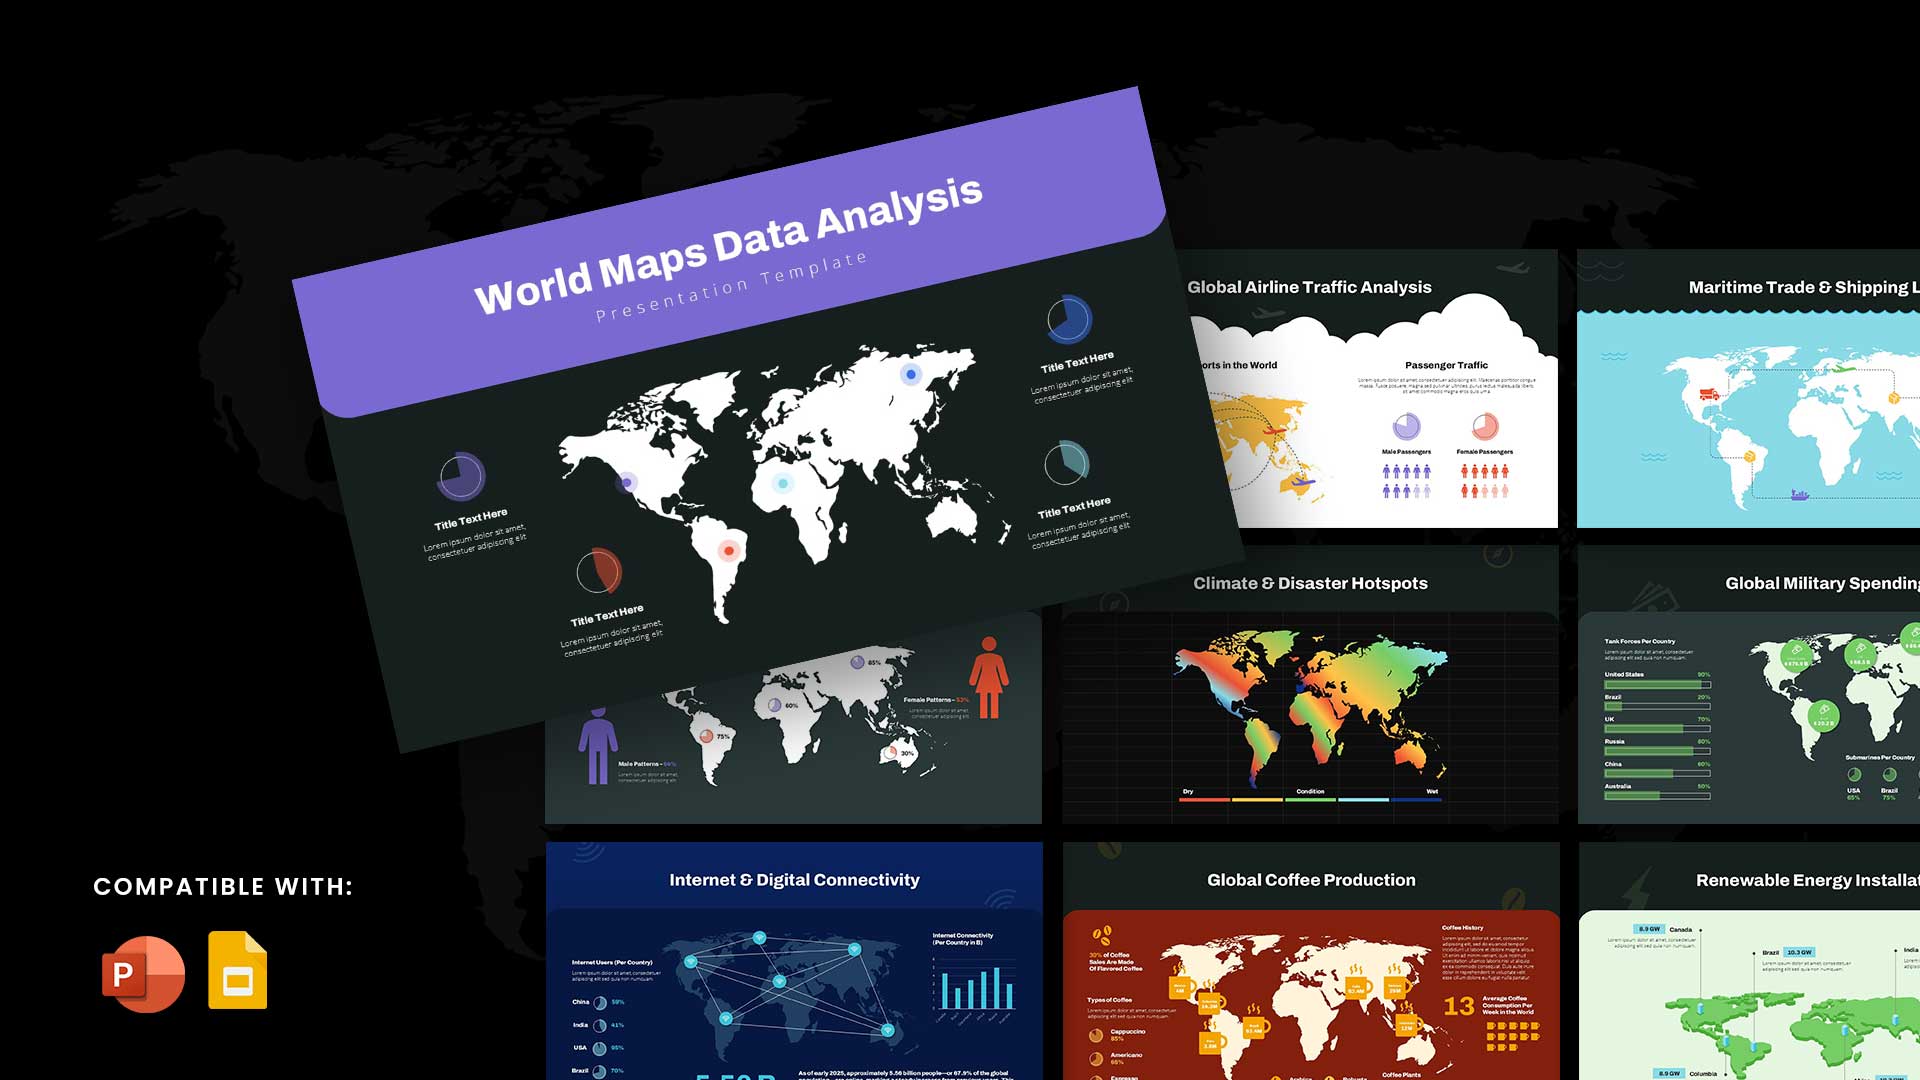
This template is part of a deck featuring multiple slides. To check out all slides, click on See All.
See All

A visually rich world map slide titled “Climate & Disaster Hotspots,” using a gradient scale from red (dry) to blue (wet) to highlight global climate zones. The map identifies regions vulnerable to extreme weather and environmental risks. Ideal for climate analysis and risk forecasting.

