
In the modern workplace, creating data visualizations has become a routine task. Our Pie Chart Google Slide offers a simple yet powerful solution, enabling viewers to grasp complex information without the need for lengthy explanations or documents.
Business leaders and professionals from diverse sectors are increasingly turning to visual representations for their innate simplicity. These tools provide an efficient way to track key performance metrics, simplify intricate data, and improve communication efficiency.
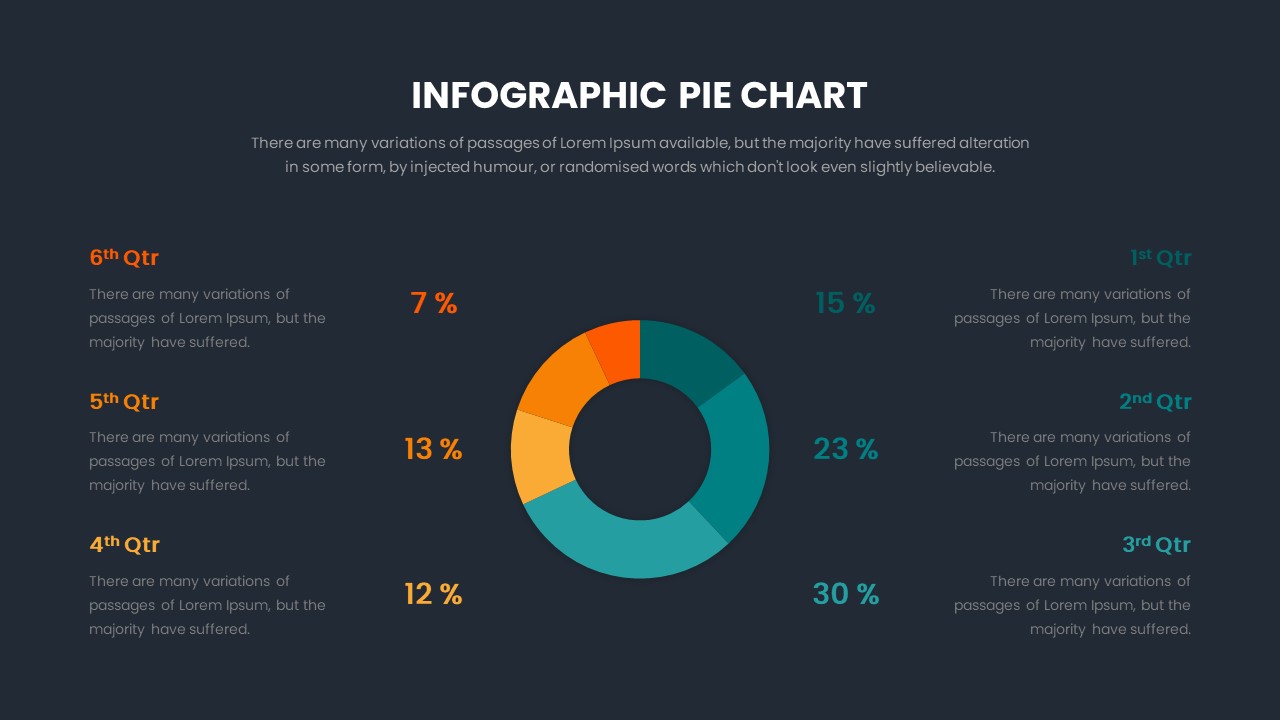
This Pie Chart Slide Template is a circular graphical representation Hit can be used to display data in a visually appealing and easy-to-understand manner. It is divided into slices, with each slice representing a proportion or percentage of the whole data set. Pie charts are commonly used to illustrate the distribution of data or to show how individual parts contribute to a whole.
They are particularly useful for conveying relative proportions, making them a popular choice for displaying categories, market shares, or any data where parts make up a whole.
Google Slide pie charts are often used to present business reports because they impress stakeholders with clear and concise financial data presentations. Using a pie chart in graphical form simply complex data for students or colleagues during lectures or workshops. As a research tool, pie charts are best for statistical pitches to win over the audience by presenting survey reports, sales trends, and market analysis.
Revolutionize your presentations with our Pie Chart Slide Template for Google Slides! Transform boring data into stunning visual stories. Engage your audience, simplify complex figures, and leave a lasting impact. Elevate your data game today! Download, edit, and use it.
Try Our Google Slides Add-On and Get Access to 4500+ Slides
-

No. of Slides
2 -

Aspect Ratio
16:9 -

Item ID
SKT00755 -

Category
Google Slides Templates