
The Waffle Chart Slide Template is a statistical diagram showing data in percentage views. It can be used as an alternative to PowerPoint pie charts and doughnut charts. A waffle chart is a visual representation used to display
progress or categorical data simply. The grid cells with color coding represent a portion of the total value to depict the data distribution. The process involves dividing the total value into equal parts, filling the grid with
shaded or colored cells to represent the data, and optionally labelling the chart for clarity. Viewers can interpret the chart by comparing the filled cells to the total grid, allowing for quick understanding of relative proportions
or progress towards a goal. Waffle charts are effective for conveying information in a visually appealing format, although they may lack precision with larger datasets or subtle differences in values.
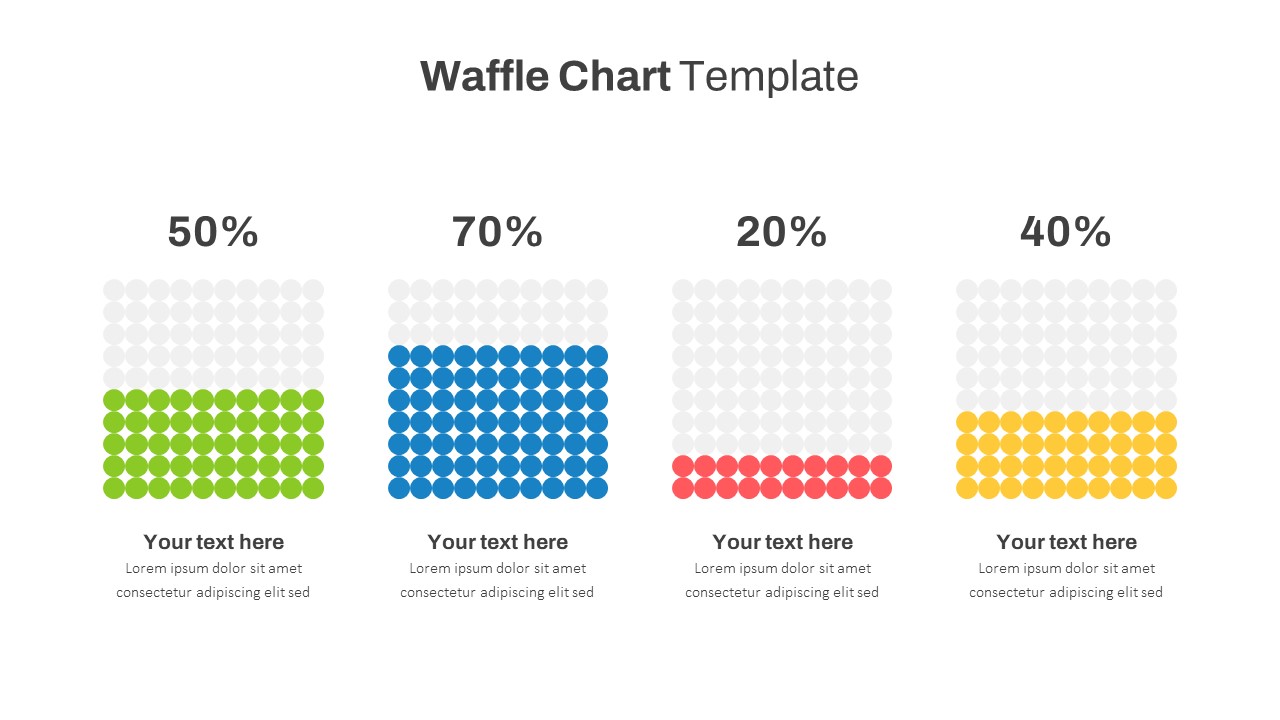
This Waffle Chart PowerPoint Template features four squares with grid cells to show percentages. The green cells show 50 %, and the blue cells depict 70 percentages because the colored grid cells are comparatively high against other squares.
Meanwhile, the red waffle shows the lowest percentage, whereas the yellow represents 40%. These types of data charts enable easy understanding of the survey results.
For example, after you are surveying the acceptability of a particular product, you can use this data-driven chart to show the outcomes categorized by different age groups.
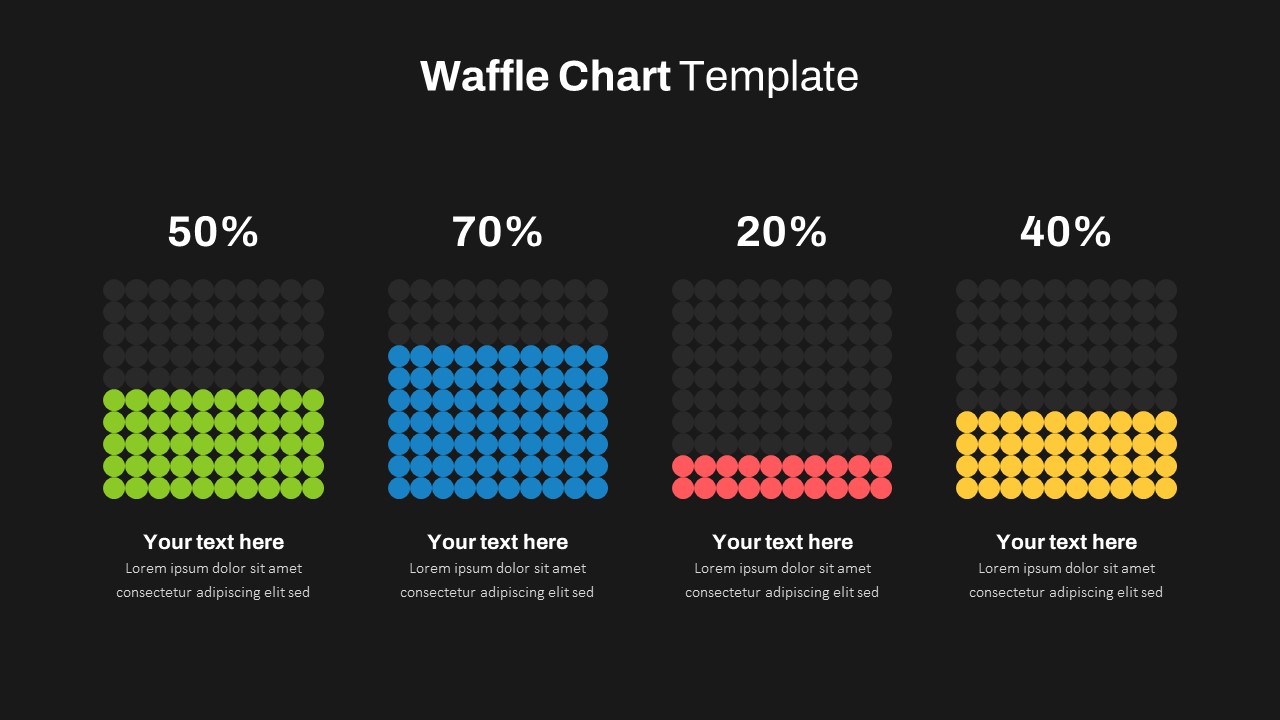
The Waffle Chart Slide Template for PowerPoint presentations is useful for demonstrating different data points in an easy-to-understand visual aid. It comes in black and white backdrops that you can change according to your preferences.
Sometimes, a white background is enough to show data precisely. This statistical ppt chart allows the users to insert percentages on the top, and at the same time, they can provide a short note at the bottom.
Use different visual aids to show your research outcomes. Get it now!
Try Our Google Slides Add-On and Get Access to 4500+ Slides
-

No. of Slides
2 -

Aspect Ratio
16:9 -

Item ID
SKT00911 -

Category
Google Slides Infographic Template