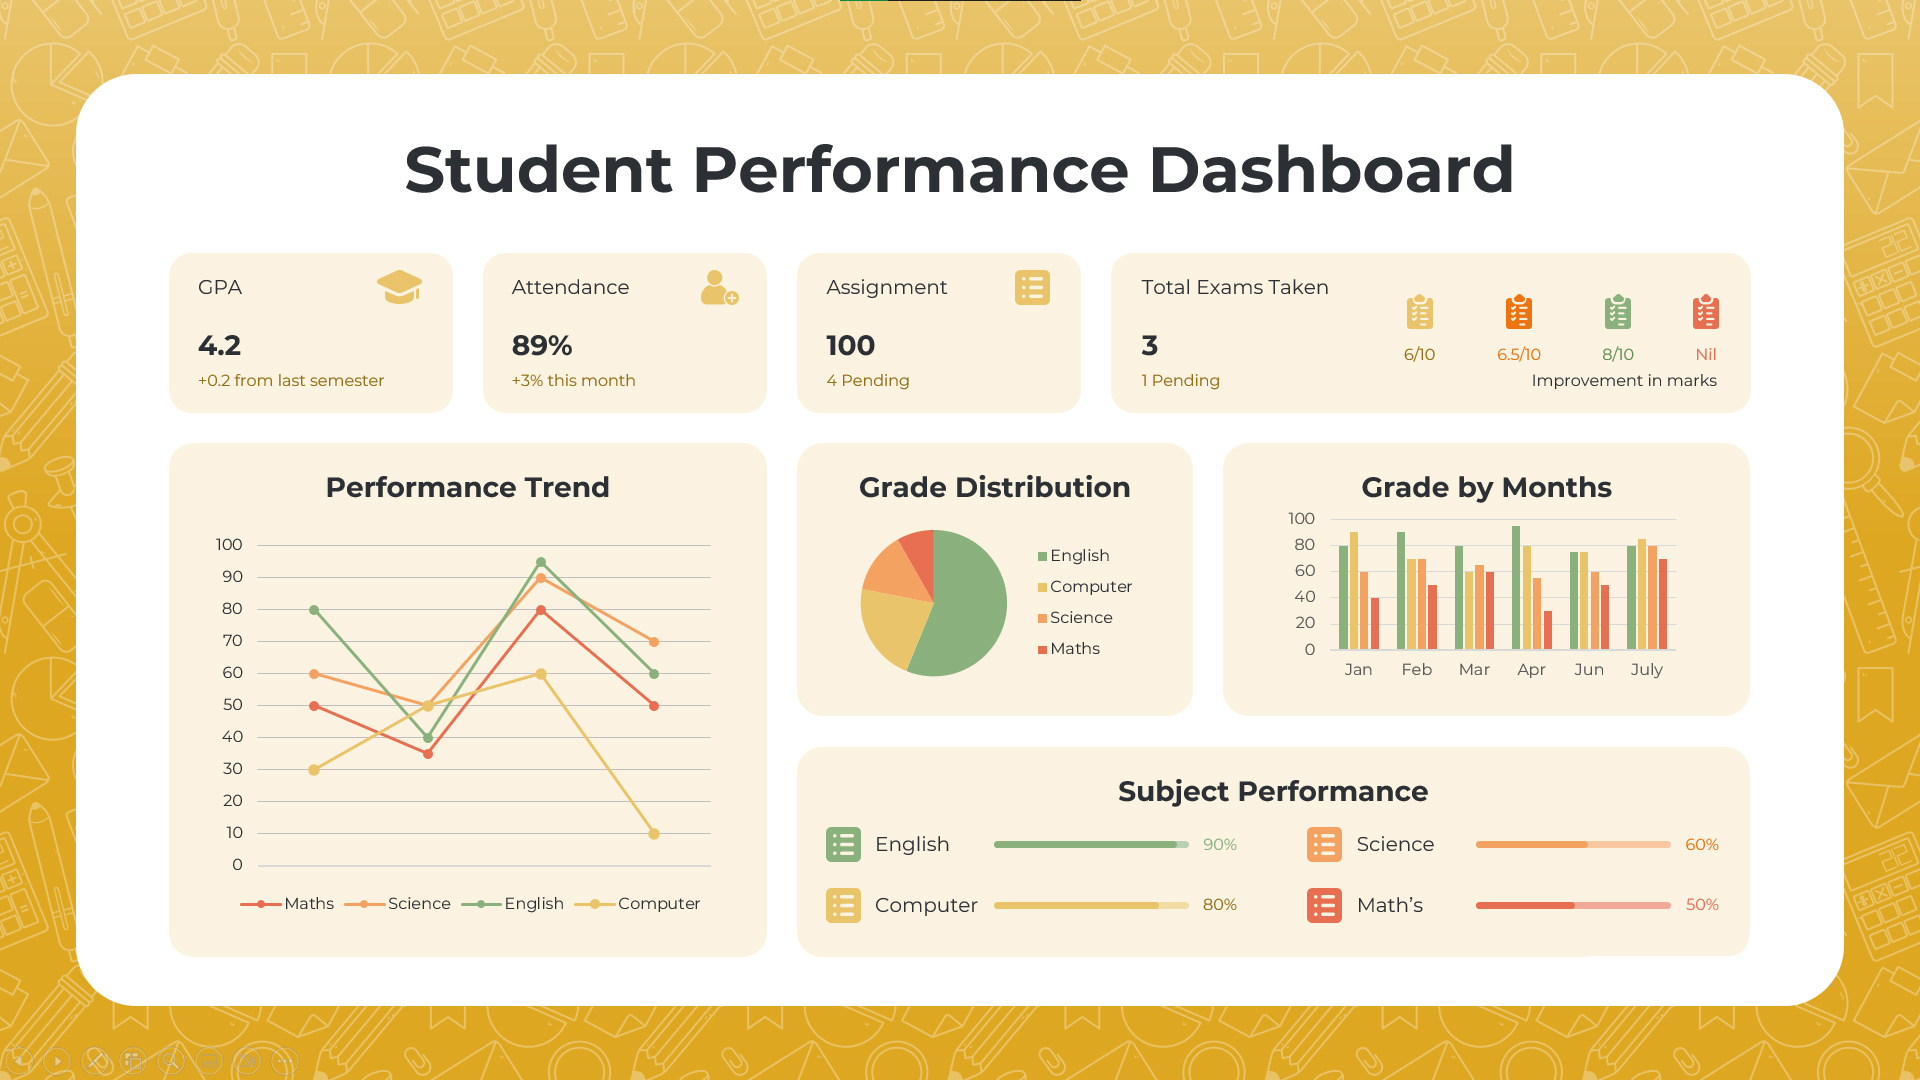
Student Performance Dashboard Template for PowerPoint and Google Slides

The Student Performance Dashboard Template is an intuitive and data-driven presentation layout designed to visualize academic progress and student metrics effectively. It provides a comprehensive overview of a student’s performance through key performance indicators such as GPA, attendance percentage, assignment status, and exam results. The dashboard seamlessly combines analytical visuals, including performance trends, grade distributions, and subject-wise progress, to help educators, administrators, and students gain a clear understanding of academic outcomes.
The template’s layout features multiple sections — from line charts tracking performance trends over time to bar graphs showing grade improvements by month — allowing users to monitor strengths and identify areas needing improvement. The grade distribution pie chart offers quick insights into overall subject performance, while the subject-specific bars highlight proficiency levels in subjects like English, Science, Maths, and Computer Studies.
This design balances clarity and visual appeal with a soft academic color palette, making it ideal for presentations in schools, universities, and e-learning environments. It helps in performance reviews, report meetings, progress tracking, and data-based teaching analysis, ensuring informed decisions for student development.
The template is fully customizable and compatible with both PowerPoint and Google Slides, enabling educators to tailor data inputs, update visuals, and showcase student analytics seamlessly.
See more

