Smart Phone User Data Template for PowerPoint and Google Slides
This template is part of a deck featuring multiple slides. To check out all slides, click on See All.
See All


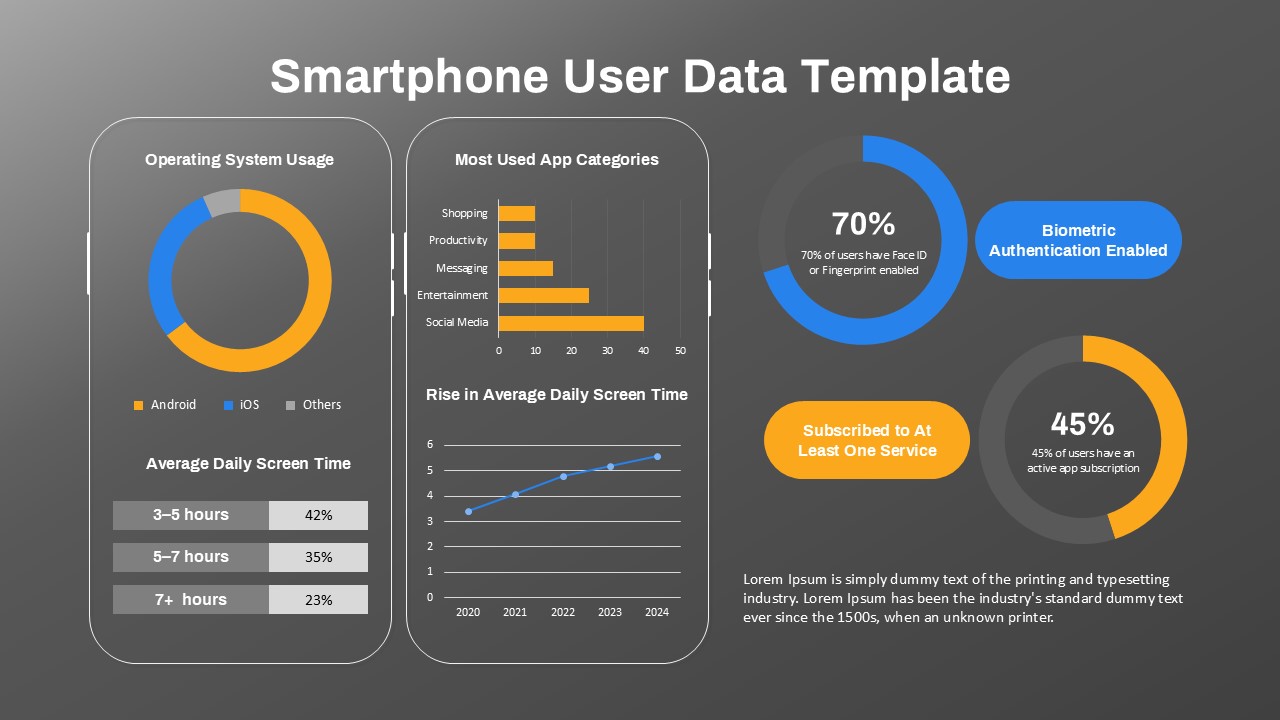
This slide presents smartphone user statistics, including a donut chart for OS usage (Android, iOS, Others), bar chart of most used app categories, screen time distribution, and a line graph of rising average screen time from 2020–2024. It also shows biometric use (70%) and app subscriptions (45%).