Simple Gantt Chart Template for PowerPoint and Google Slides
This template is part of a deck featuring multiple slides. To check out all slides, click on See All.
See All

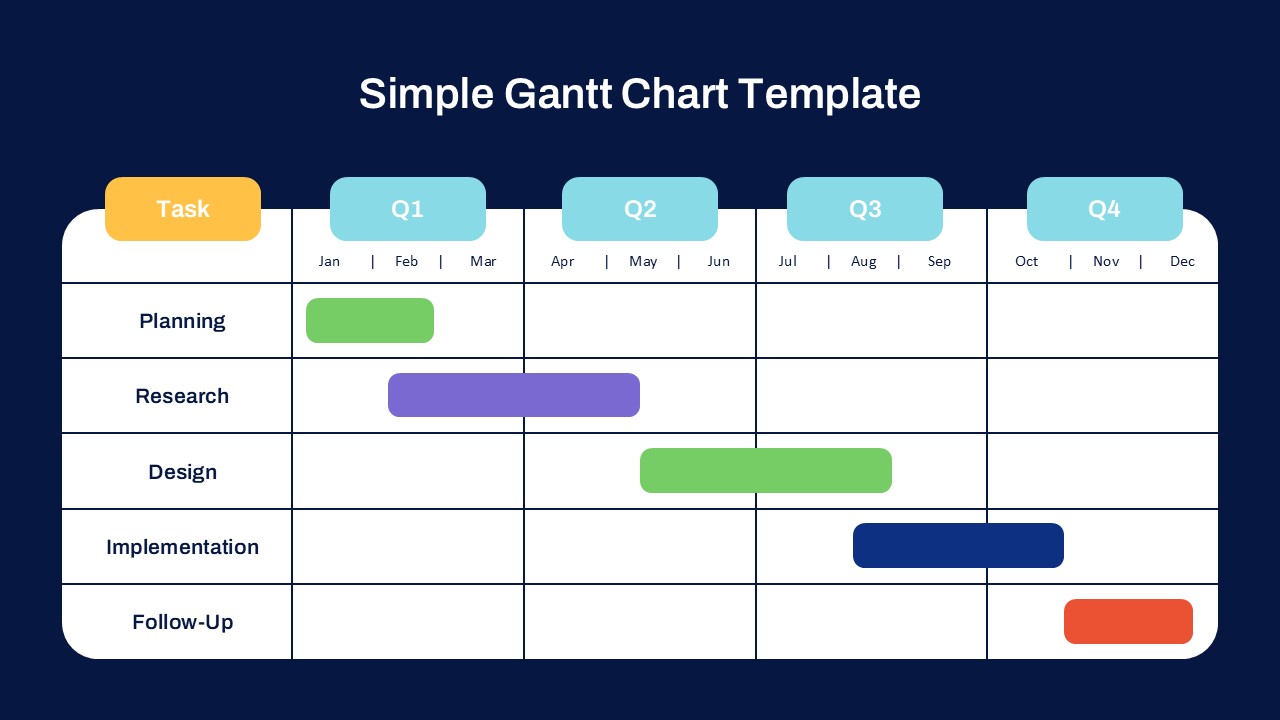
This simple Gantt chart PowerPoint slide template displays a yearly project timeline divided by quarters (Q1–Q4). Tasks like Planning, Research, Design, Implementation, and Follow-Up are visually mapped across months for easy project tracking and scheduling.

