Quarterly Sales Chart PowerPoint Template
This template is part of a deck featuring multiple slides. To check out all slides, click on See All.
See All

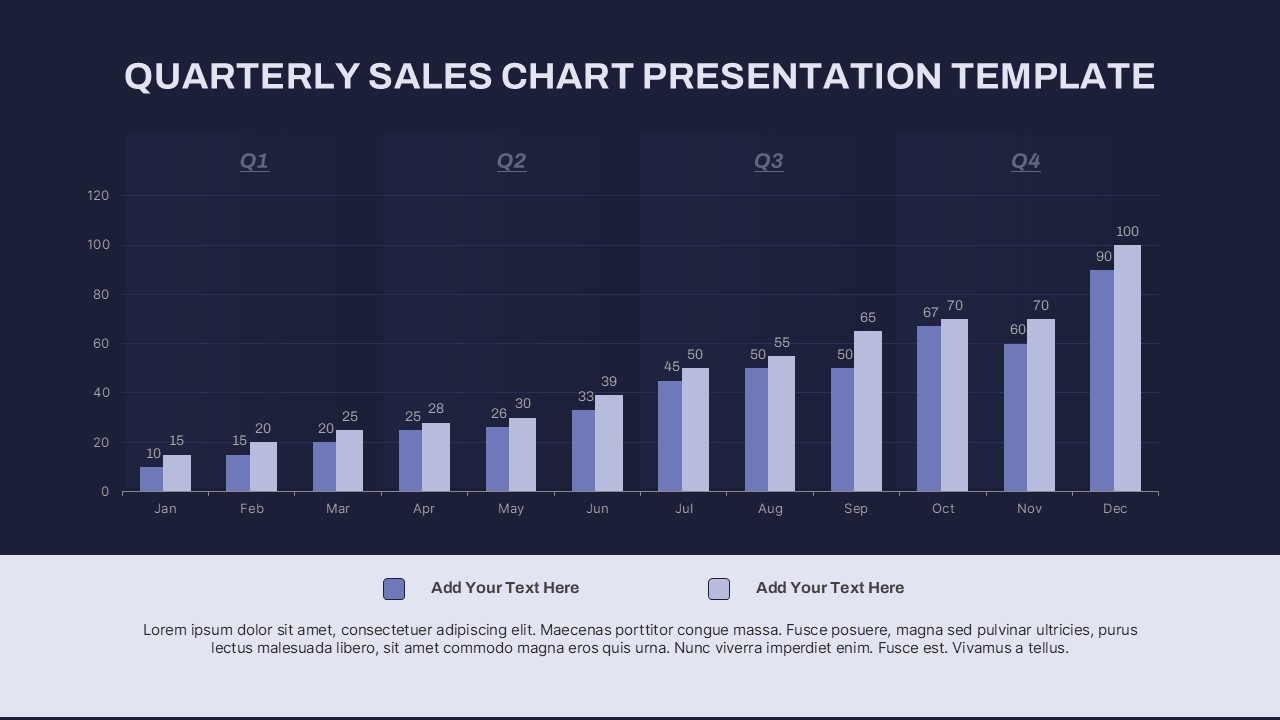
This PowerPoint slide template displays a bar chart illustrating quarterly sales performance. The chart includes monthly sales data for each quarter, starting from January to December, with sales numbers gradually increasing. The design features placeholders for text at the bottom and a modern, dark-colored background suitable for business presentations

