Dark Theme Google Slide Progress Bar


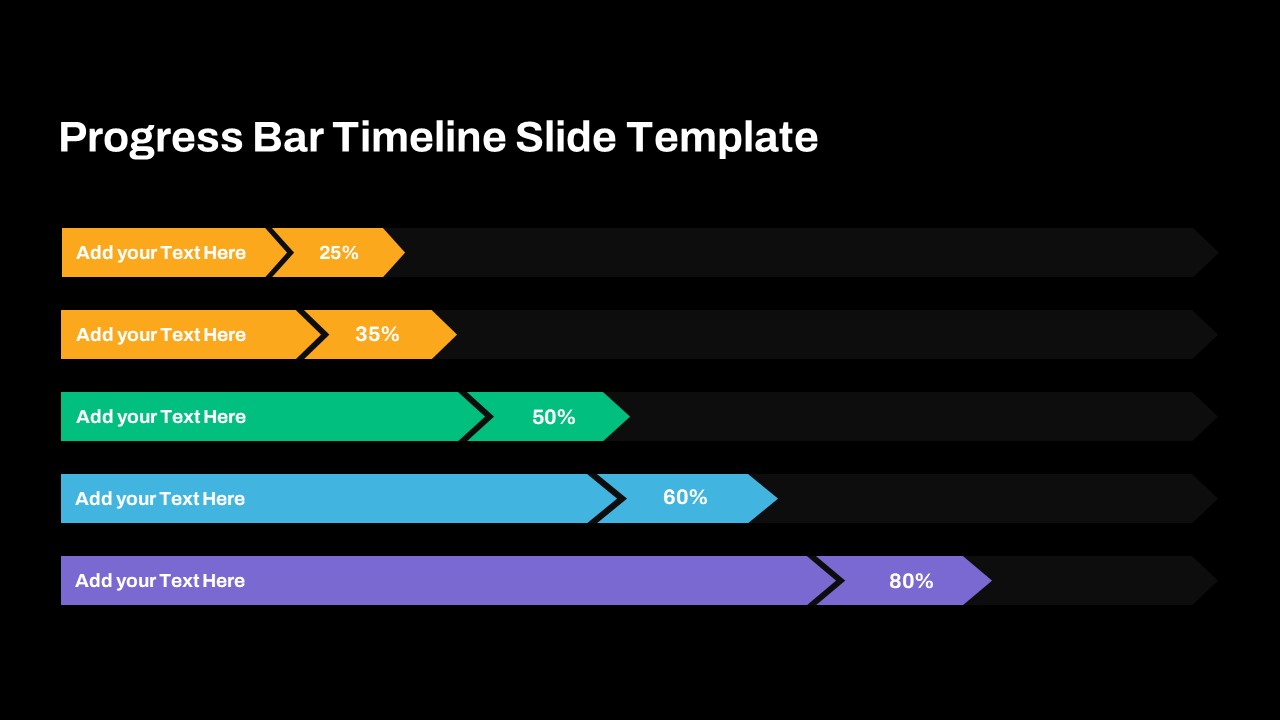
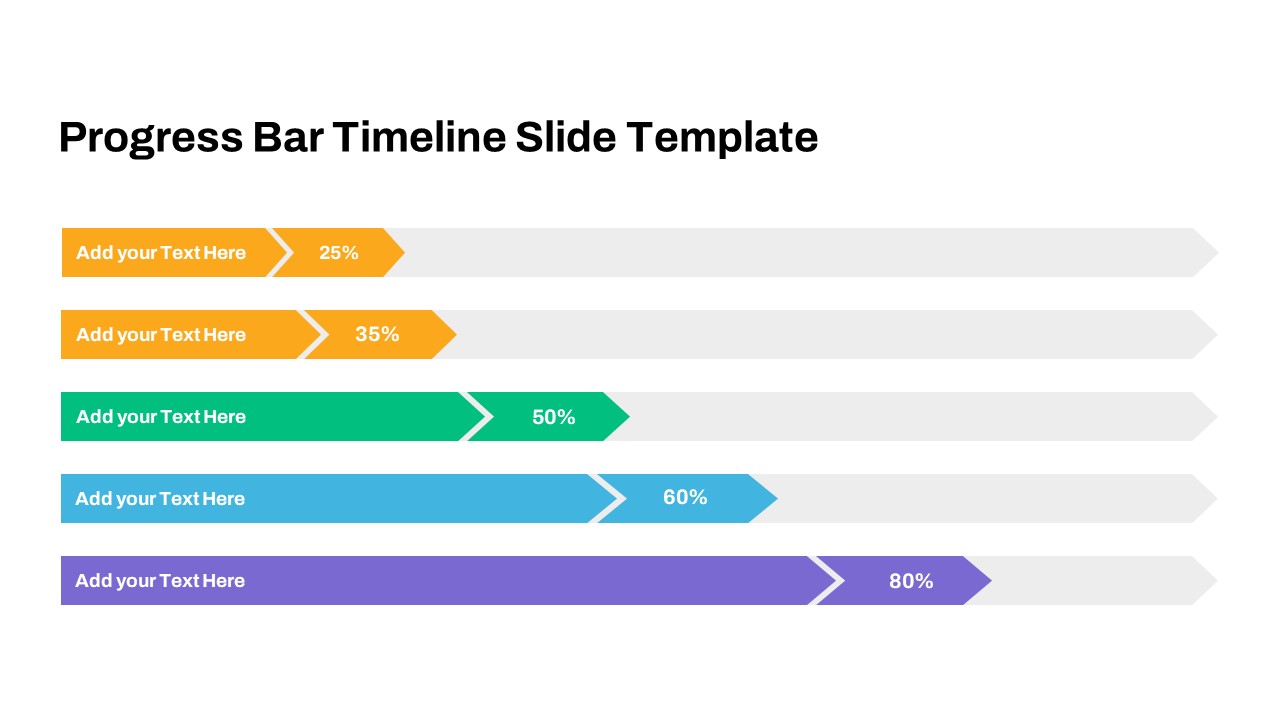
Use our Progress Bar Slide to vividly illustrate your company's journey towards goal achievement and project completion. This status bar chart perfectly communicates your project's current standing, providing a clear visual representation of progress. With customizable editing options, you can effortlessly imprint precise percentages of completed tasks and showcase real-time statistics through a cutting-edge and visually appealing infographic. As the name suggests, the Google Slide Progress Bar excels in summarizing milestone tracking and performance metrics, making it an indispensable tool for effective communication. This simple presentation element is not only compatible with PowerPoint but also integrates into Google Slides, enhancing its accessibility for diverse platforms. Its widespread application extends to presentations, reports, and dashboards, where it excels in delivering a comprehensive overview of timelines, milestones, and completion rates. This innovative progress chart for Google Slides doesn't merely present data; it transforms complex information into an easily digestible format. The length of the bar serves as a tangible indicator of overall progress, allowing your audience to quickly grasp the status of your projects. Whether you're presenting to stakeholders, team members, or clients, this visual aid enhances understanding and engagement. Elevate your communication strategy by incorporating this useful tool, ensuring that your audience gains valuable insights effortlessly and remains engaged throughout your presentation. The editable progress chart slide has two background options that enable the user to choose one of them. The arrow edge conveys the percentage of work completion or progress over the week or month. The presenter can change the color, and size of bars, texts, and shapes accordingly. Download progress chart template for Google Slide and PowerPoint presentation. Get it now!
See more


