Plan Vs Actual Milestone Chart Template For PowerPoint and Google Slides

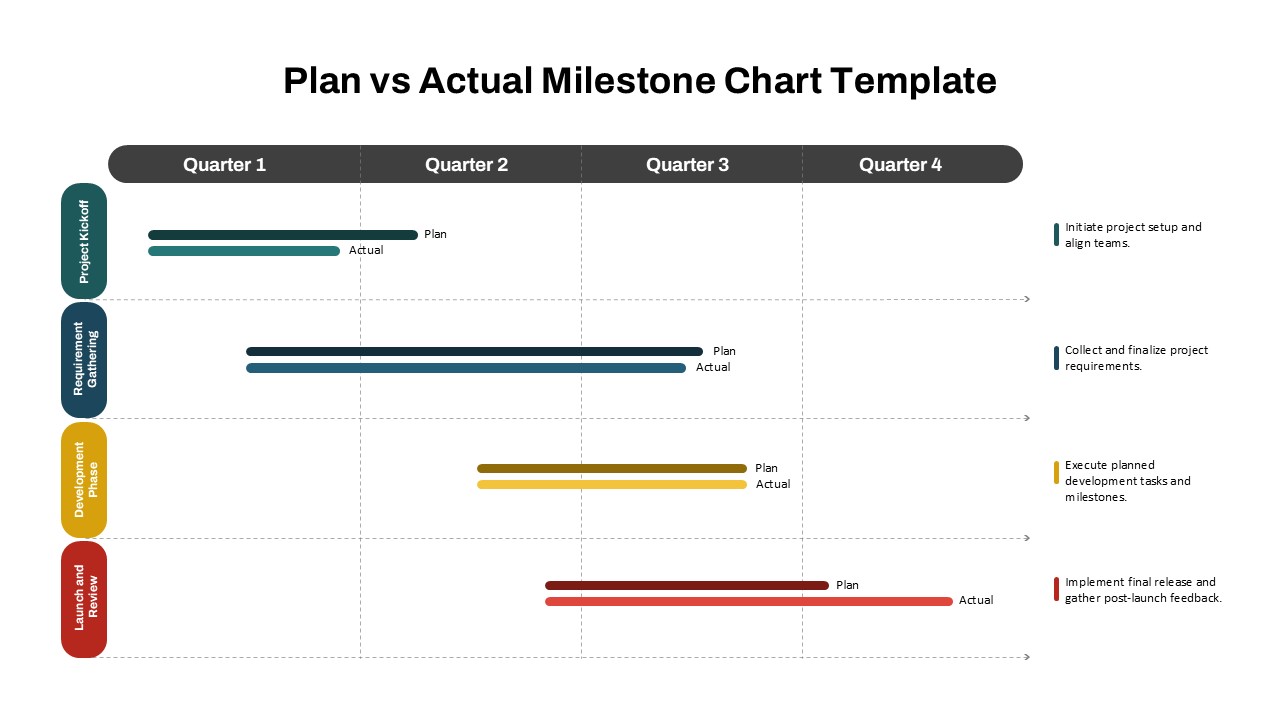
Effectively track and compare your project milestones with this Plan vs. Actual Milestone Chart PowerPoint Template. Designed for project managers, business analysts, and teams who need to keep track of project timelines, this template offers a clear side-by-side view of planned versus actual progress for each phase. With quarterly breakdowns and customizable color-coded bars, this template helps you identify variances, assess delays, and communicate project status to stakeholders in a visually straightforward format.
Each row represents a key project phase—such as Project Kickoff, Requirement Gathering, Development Phase, and Launch and Review—allowing you to map out planned timelines and actual completion dates in a simple layout. This visual format is ideal for quarterly reviews, project status updates, and performance analysis, making it easy for your team to see where delays may have occurred and adjust plans accordingly. The structured design provides ample space to add notes, ensuring everyone understands the factors impacting project timelines.
Fully customizable and compatible with both PowerPoint and Google Slides, this template can be adapted to fit your specific project needs. Whether you’re tracking product development, software implementation, or marketing campaigns, this Plan vs. Actual Milestone Chart Template makes it easy to present project progress with clarity and precision.
See more


