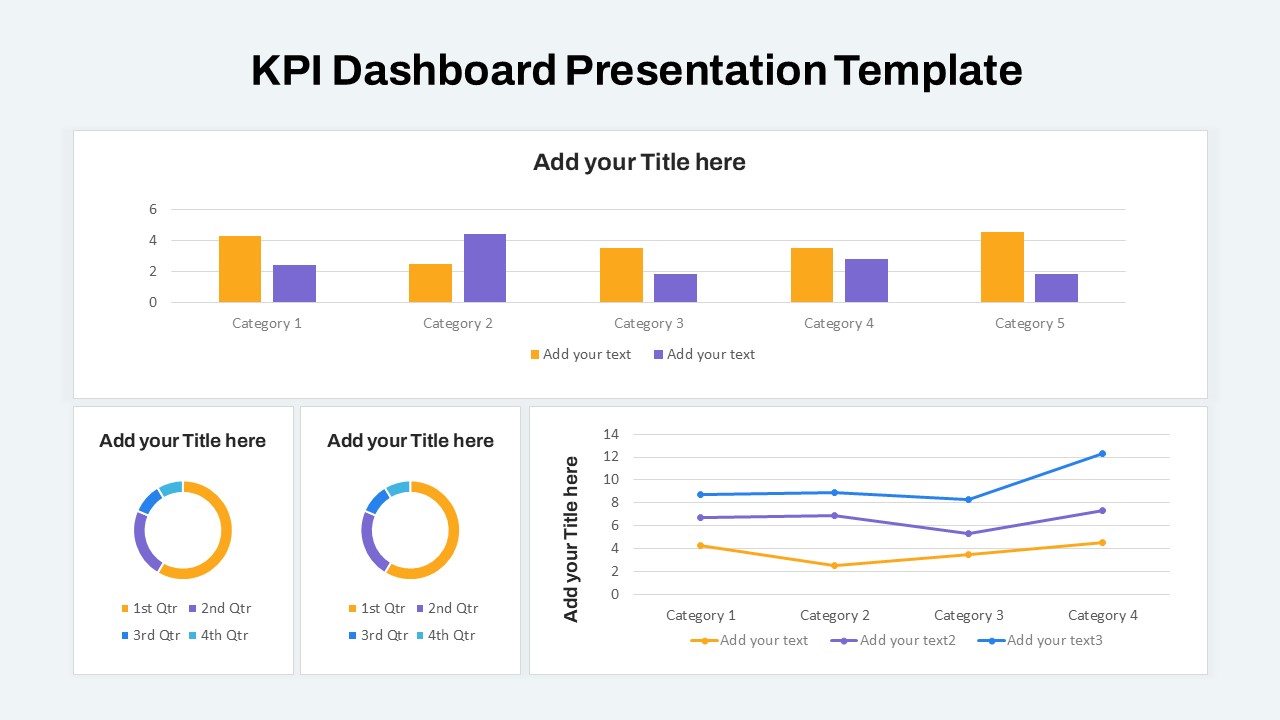
Free PowerPoint KPI Dashboard Presentation Template


Enhance your data-driven presentations with the KPI Dashboard Presentation Template, designed to provide a clear and concise overview of key performance indicators (KPIs). This Free KPI PowerPoint template is tailored for professionals who need to present complex data in an easy-to-understand format, making it ideal for business reviews, performance tracking, and strategic planning.
The template features a variety of charts and graphs, including pie charts, percentage dials, and numerical displays, enabling you to showcase critical metrics at a glance. The clean, minimalist design ensures that your data stands out without being cluttered by unnecessary elements. Each section is fully customizable, allowing you to input your specific KPIs, add descriptive text, and adjust colors to match your brand or theme.
Whether you're presenting quarterly results to stakeholders, tracking team performance, or monitoring project milestones, this template provides a professional platform to communicate your insights effectively. The large numerical display section is perfect for highlighting key figures, while the segmented pie charts allow for detailed breakdowns of data. This versatility ensures that your audience remains engaged and informed throughout your presentation.
Available for both PowerPoint and Google Slides, this template offers the flexibility you need to create a presentation that aligns with your objectives. Save time and enhance your data storytelling with this user-friendly KPI Dashboard Presentation Template.
See more


