Pie Chart PPT

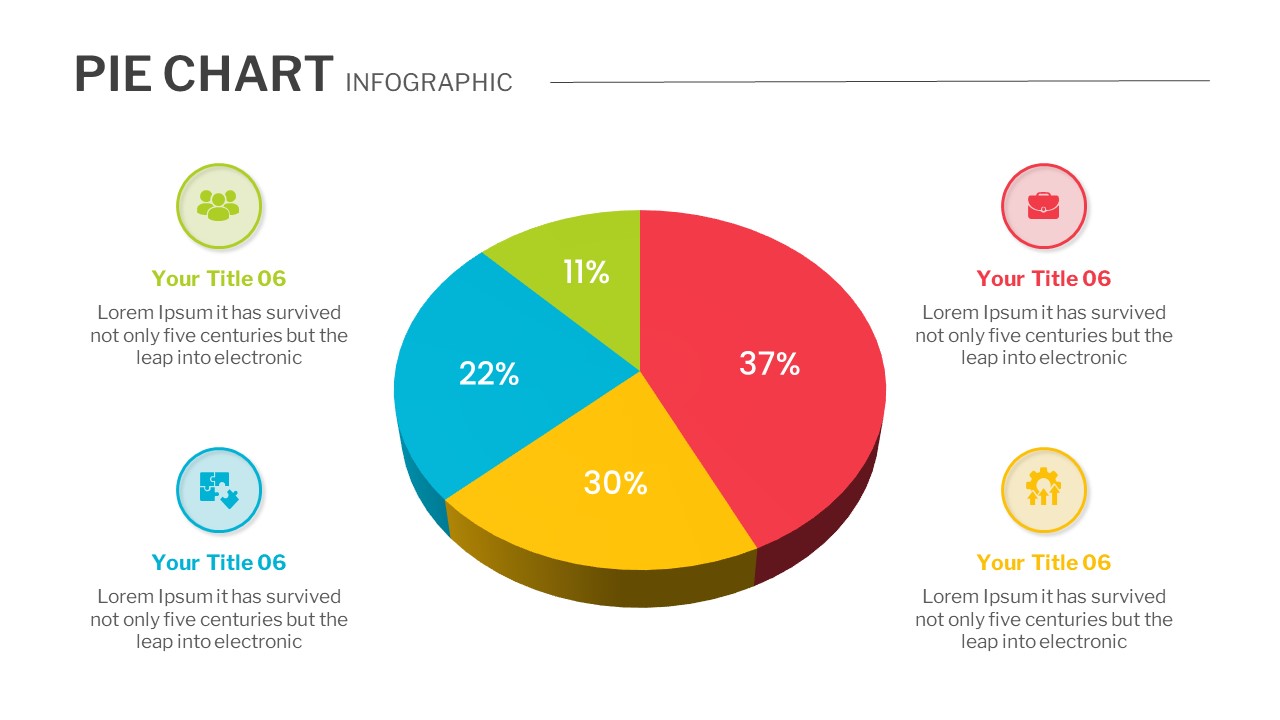
A statistical chart will speak more than a textual document it will explain research reports, sales data, financial trends, and all data in numerical ratios. A Pie Chart PPT will show proportions and percentages between categories by segmenting a circle into different sizes.Our Pie Chart Template for PowerPoint features vibrant colors that effectively differentiate data segments, ensuring easy readability. Each segment represents distinct values, enhancing visual clarity. Presenters can conveniently add their comments using text placeholders adorned with engaging infographic clipart. The flexibility of the template allows users to modify color codes and backgrounds without affecting image resolution. Experience the convenience and visual impact of our Pie Chart template today! Download our Infographic Pie Chart Templates to share your facts and figures with a visually appealing data-driven diagram.
See more


