Growth Share Matrix (BCG Matrix) PowerPoint Template
This template is part of a deck featuring multiple slides. To check out all slides, click on See All.
See All

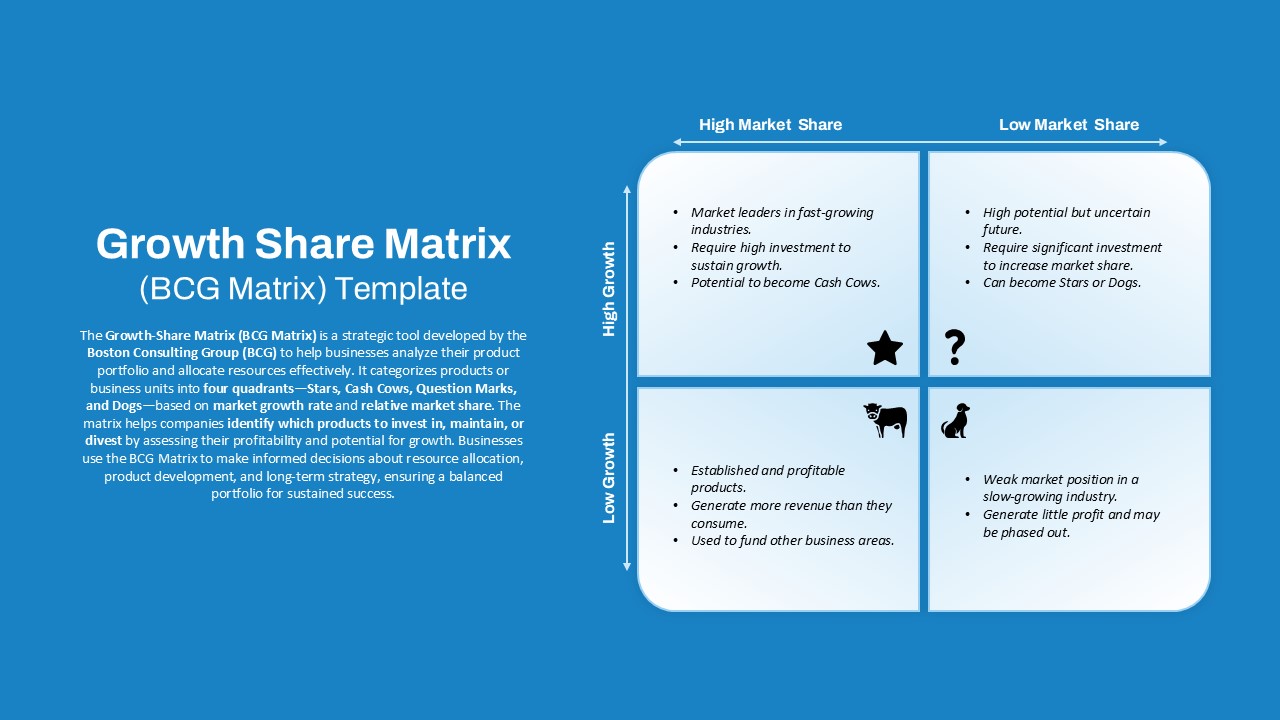
This PowerPoint slide presents the Growth Share Matrix (BCG Matrix), a strategic tool for analyzing business product portfolios based on market growth and market share. The matrix is divided into four quadrants: Stars (high growth, high share), Question Marks (high growth, low share), Cash Cows (low growth, high share), and Dogs (low growth, low share).

