Comparison Template Google Slides

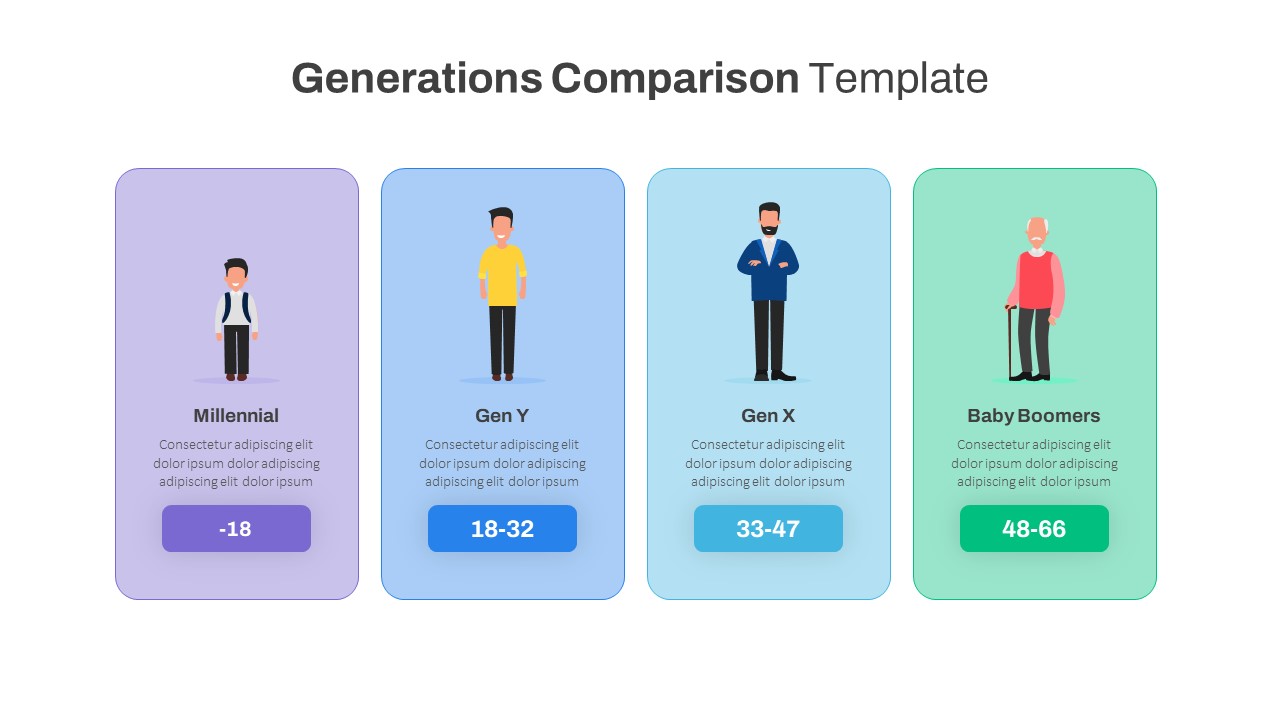
The comparison slide template is a poster Google Slide for comparing data sets with precision and clarity. It is tailored for product analysis with editable options for detailing product features with precision. Departing from the traditional folded two-layer layout of typical product comparison charts, this design presents a modulated format in a poster timeline sequence. Versatile for comparing products, services, features, pricing plans, and statistics, it transcends conventional comparison slides. Its natural design ensures audiences effortlessly comprehend distinctions and similarities, elevating your presentations to be both informative and visually engaging. Utilize this template to enhance your communication of complex data sets with ease. The comparison template Google Slides features a generation comparison presentation with a cartoon illustration of Millennials, Gen Y, Gen X and Baby Boomers. This comparison slide template is perfect for crafting presentations or infographics focused on Millennials, Gen Y, Gen X, and Baby Boomers. Specifically designed for Google Slides, it features creative slide designs tailored for presenting generation charts and diagrams. Ideal for highlighting key differences between each generation, this template streamlines the process of conveying complex information about Millennials, Gen Y, Gen X, and Baby Boomers in a visually engaging manner. Elevate your presentations using this template's user-friendly designs to effectively communicate insights about diverse generational characteristics. Boost the effectiveness of your presentations by incorporating detailed generation charts. You can use this template to present essential aspects such as salary, and technology usage, generation gap, and societal roles for each generation. Utilize the slide designs within this Google Slide template to emphasize and elucidate the distinctions between Millennials, Gen Y, Gen X, and Baby Boomers. The comparison slide template contains cartoon human illustrations within a specific age group. Each box is colored differently in the background and the attire of human sketches. The presenters can adjust or modify each feature including color, size, and shape. Download editable comparison charts for PowerPoint and Google Slide now!
See more


