Gantt Chart Project Status Report Template
The Gantt Chart Project Status Report Template is an essential tool for project managers and teams to visually organize and track project timelines, tasks, and milestones. Featuring a clean and structured layout, this Gantt chart PowerPoint template is designed to display multiple tasks with their respective durations, making it easy to monitor progress and allocate resources effectively.
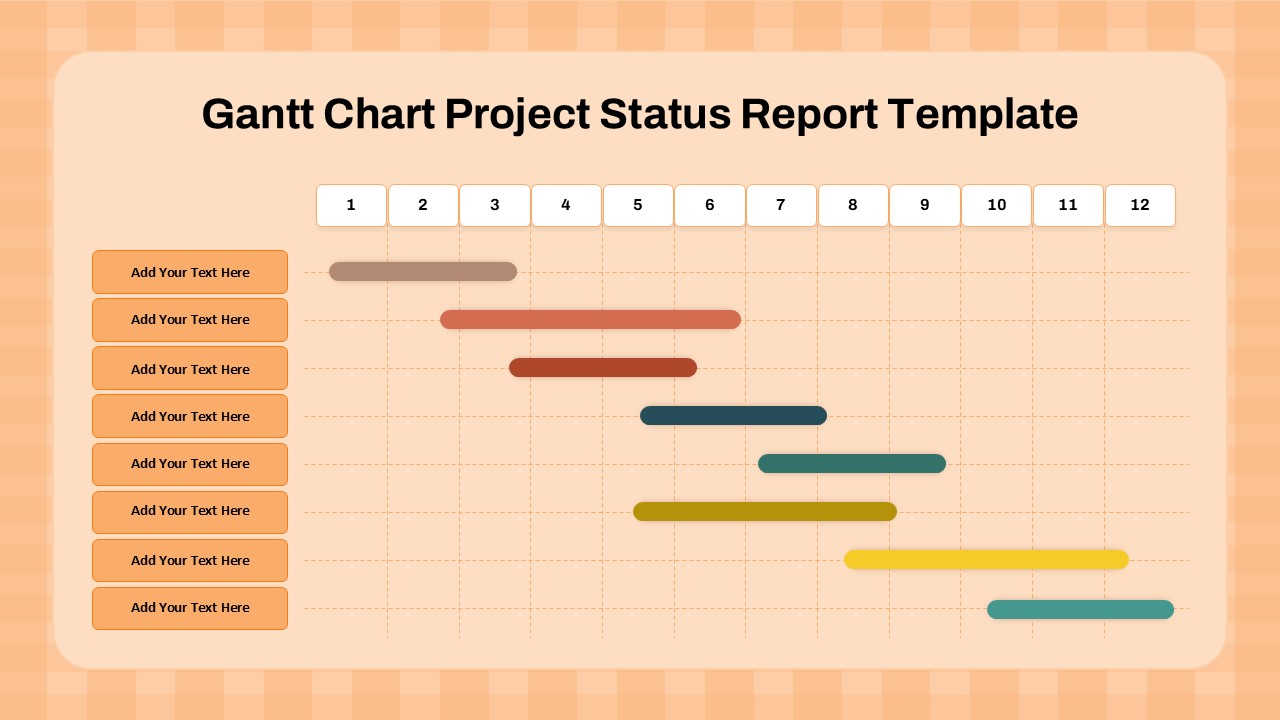
This template includes a horizontal time scale, task rows, and color-coded bars to represent task durations across a 12-month period. The design allows for clear tracking of overlapping tasks, dependencies, and key deliverables, making it perfect for planning and reporting project status during meetings or reviews.
Customizable in both PowerPoint and Google Slides, this template offers flexibility to tailor task descriptions, timeframes, and colors to align with specific project requirements. Whether you’re managing marketing campaigns, IT development projects, or operational workflows, this Gantt Chart Template helps streamline communication, ensuring teams and stakeholders stay informed and aligned.
See more

