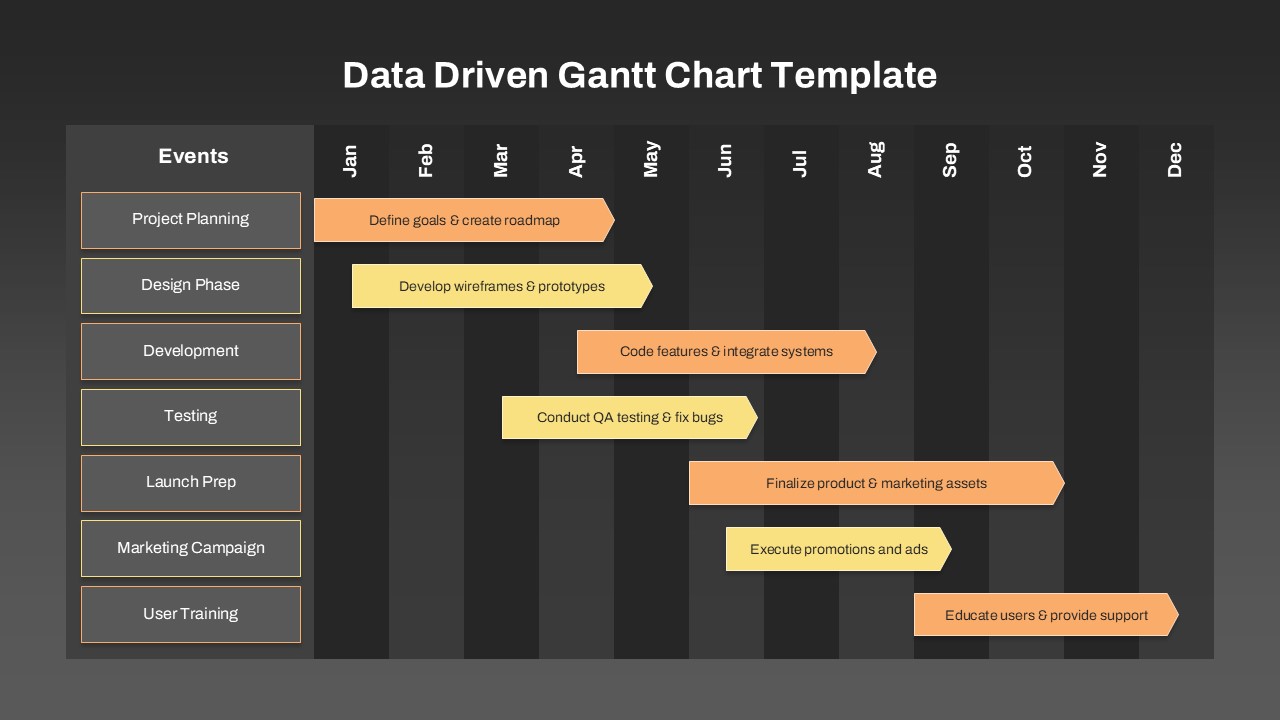
Modern Dark Theme Data Driven Gantt Chart for PowerPoint and Google Slides

This template is part of a deck featuring multiple slides. To check out all slides, click on See All. See All round right arrow

The data-driven Gantt chart for PowerPoint and Google Slides template is an essential tool for project managers, business leaders, and teams looking to streamline their workflows and timelines. Designed with a modern dark theme, this gantt chart slide template visually represents tasks, milestones, and deadlines in a clear and structured manner.

This Gantt chart template is ideal for tracking project planning, software development, marketing campaigns, product launches, and operational schedules. With a month-by-month timeline, users can easily monitor the progress of different project phases, including planning, design, development, testing, marketing, and user training.

Key Features:

Data-Driven Design – Easily update and customize based on real-time project status
Task Categorization – Clearly defined project phases for better team collaboration
Customizable Color Coding – Differentiate tasks with personalized colors
Compatible with PowerPoint & Google Slides – Easily editable for any business use case

Whether you're managing an IT project, marketing strategy, or business operation, this template allows you to visually communicate project status, dependencies, and deadlines. It’s a perfect solution for team meetings, stakeholder reports, and agile project planning.

Ensure efficiency and organization in your projects with the Data-Driven Gantt Chart Presentation Template—a professional and intuitive way to map out project success.

See more