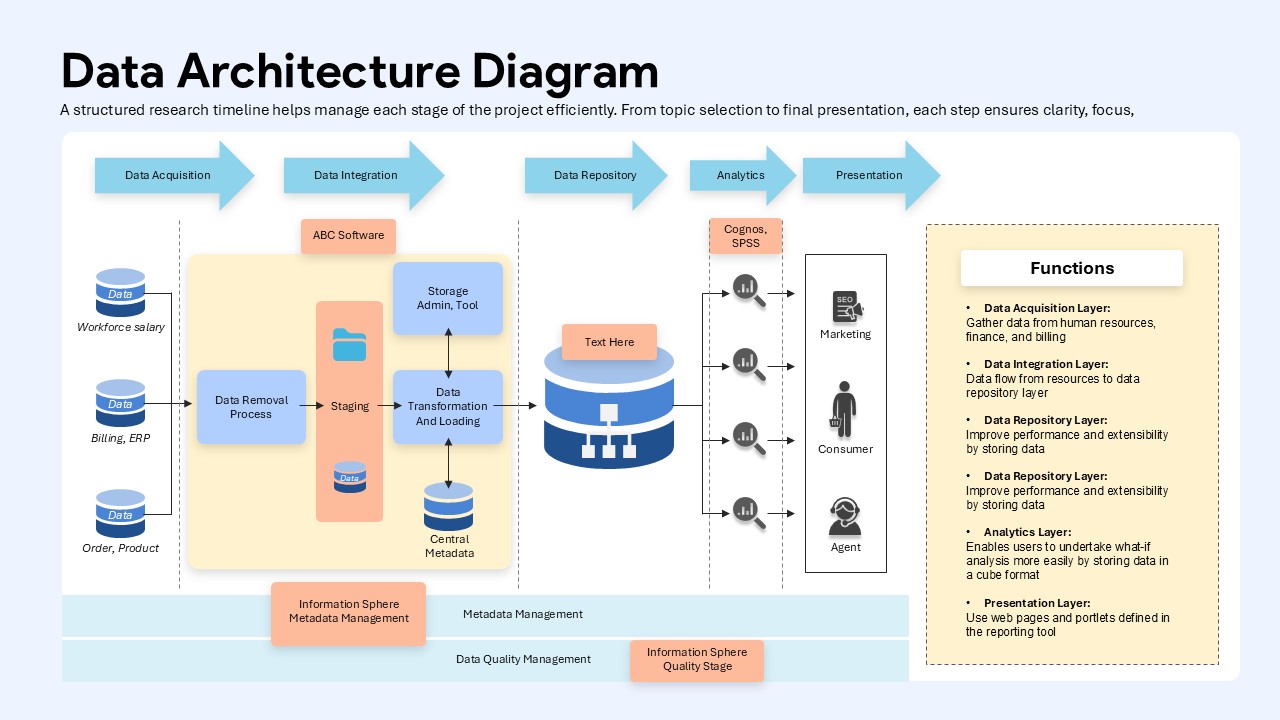
Data Architecture Workflow Diagram for PowerPoint & Google Slides

This Data Architecture Workflow Diagram offers a visually structured overview of how enterprise data flows from acquisition to final presentation. Featuring a step-by-step process divided into five key stages—Data Acquisition, Data Integration, Data Repository, Analytics, and Presentation—this slide is ideal for mapping out your organization's data lifecycle. Each stage is clearly color-coded with labeled arrows, creating a seamless left-to-right progression for viewer comprehension.
The diagram integrates critical functions such as staging, data transformation, and metadata management within a dedicated central module, showcasing how raw inputs like workforce, billing, and product data pass through cleansing and processing layers before reaching storage and analytics systems like Cognos and SPSS. On the far right, the output layer connects directly to end users such as marketers, consumers, and agents.
A sidebar labeled “Functions” explains each architectural layer in concise terms, reinforcing educational and onboarding value. The layout’s clean lines, pastel color palette, and iconography provide visual clarity while maintaining a professional tone. Fully editable in PowerPoint and Google Slides, the diagram is ideal for IT teams, data scientists, and enterprise architects communicating complex systems to technical or non-technical audiences.
See more

