Budget Timeline Template For PowerPoint and Google Slides
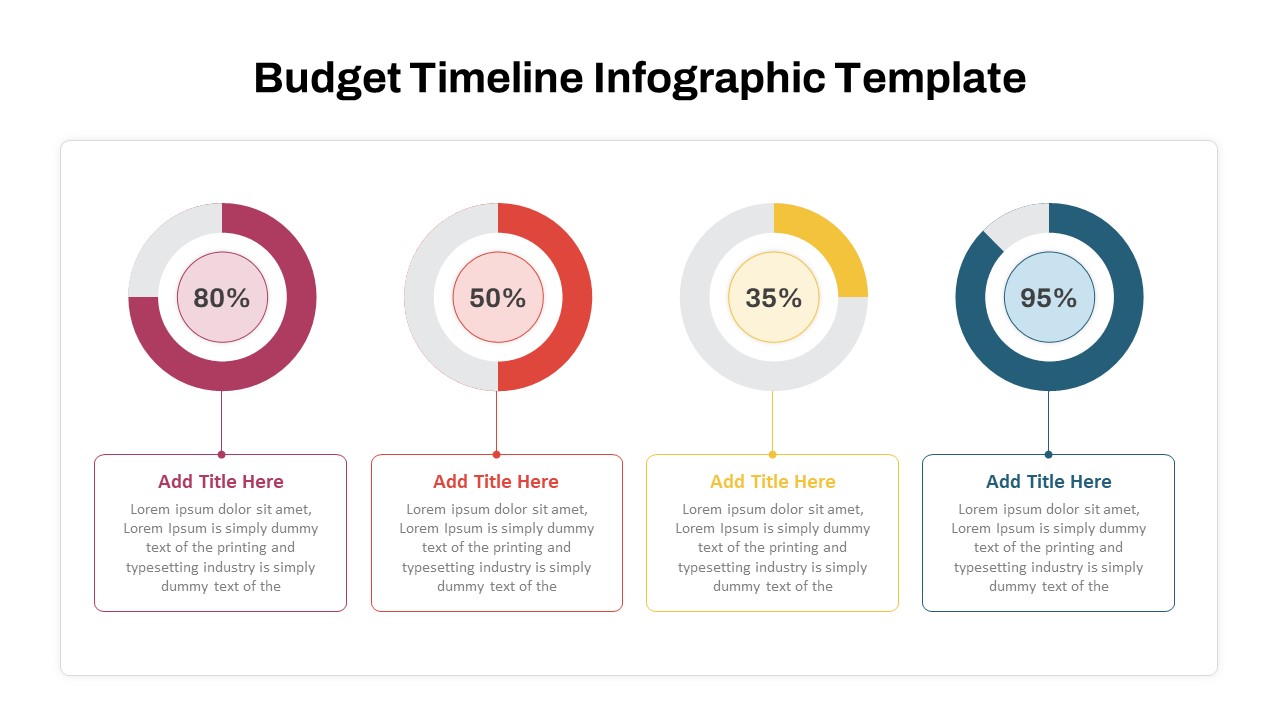
The Budget Timeline Infographic Template is an excellent visual tool for presenting budgetary progress, allocations, or financial milestones over a specific timeline. This timeline budget template uses an engaging combination of donut charts and detailed text boxes to provide a clear and concise breakdown of data. Each section highlights a percentage value, allowing users to showcase progress, distribution, or performance in an intuitive manner.
Ideal for finance teams, project managers, and educators, this template provides a professional way to illustrate budgeting phases, expenditure tracking, or fundraising goals. The layout ensures that your data is presented logically and with visual clarity, helping stakeholders understand the key metrics at a glance. The design allows users to associate each percentage with a specific timeline event or milestone, creating a seamless narrative.
Available for PowerPoint and Google Slides, this fully customizable template lets users modify colors, percentages, and text to align with their organizational goals or branding. Whether used for budget reviews, financial planning, or operational updates, this template is a valuable addition to any professional presentation.
See more

