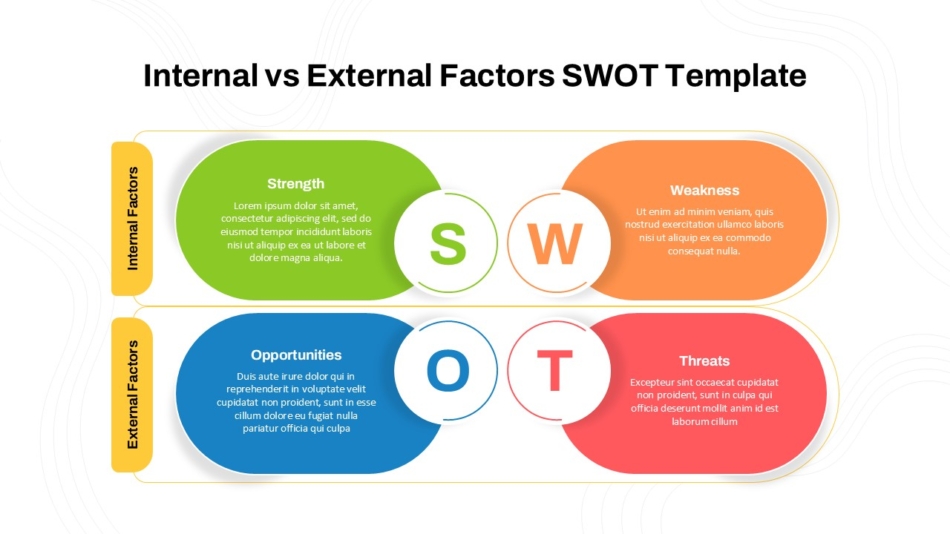
Internal vs External Factors SWOT Analysis Template


Strategic analysis remains one of the most widely used planning frameworks in business, offering a structured approach to evaluating strengths, weaknesses, opportunities, and threats. While the concept itself is straightforward, presenting these findings effectively in business settings requires more than simply listing items in four quadrants. The way strategic analysis is visualized and communicated can significantly impact decision-making, stakeholder alignment, and organizational buy-in.
Business professionals across industries face a common challenge: transforming strategic planning from an analytical exercise into a compelling presentation that drives action. Whether pitching to investors, aligning executive teams, or guiding departmental strategy sessions, the presentation format matters as much as the analysis itself. A well-structured SWOT PPT slide can turn abstract strategic thinking into concrete business discussions that lead to measurable outcomes.
This guide explores best practices for incorporating strategic frameworks into business presentations, from choosing appropriate templates to customizing visualizations that resonate with specific audiences and business contexts.
Understanding Strategic Analysis in Presentation Contexts
Strategic frameworks serve different purposes depending on the business context and audience. Planning sessions demand comprehensive frameworks that explore each dimension in depth, while investor presentations benefit from focused, high-impact visualizations that highlight competitive positioning and growth potential.
The internal-external distinction within strategic analysis provides a useful organizational principle for presentations. Strengths and weaknesses represent internal factors within organizational control, while opportunities and threats emerge from external market conditions and competitive dynamics. According to research from the Strategic Management Journal, presentations that clearly differentiate between controllable and external factors help audiences understand both current capabilities and environmental realities.
Board-level presentations typically require analysis that connects directly to financial performance, market positioning, and long-term strategic direction. These presentations benefit from data-backed assertions in each area and clear linkages between findings and recommended actions.
Department or team-level presentations often use these frameworks to evaluate specific initiatives, products, or operational areas. These contexts allow for more detailed exploration of tactical considerations within each dimension.
Client-facing presentations leverage strategic analysis to demonstrate thinking and problem-solving capabilities. In these scenarios, visual clarity and professional presentation quality become particularly important for establishing credibility.
Understanding these contextual differences helps determine which template styles and presentation approaches will serve specific communication objectives most effectively.
Selecting the Right SWOT Template for Your Presentation
Template selection significantly influences how audiences receive and engage with SWOT analysis. Different template designs serve different strategic purposes and presentation contexts.
Traditional Four-Quadrant Layouts
Classic SWOT templates organize content into four equal sections, creating balanced visual weight across all analysis dimensions. Business SWOT analysis templates follow this traditional format, providing familiar frameworks that audiences immediately recognize.

These templates work particularly well for comprehensive strategic reviews where each SWOT component deserves equal attention and discussion time. The symmetrical layout doesn't privilege any single quadrant, allowing presenters to guide audience focus through narrative rather than visual hierarchy.
Product-Specific SWOT Frameworks
Product launches, evaluations, and lifecycle assessments benefit from specialized SWOT formats. Product SWOT analysis templates accommodate product-specific considerations like feature comparisons, market positioning, development roadmaps, and competitive differentiation.

These templates often include space for product imagery, competitive matrices, or market data that provides context for SWOT findings. This integration helps audiences connect strategic analysis directly to tangible product attributes.
Creative and Visual SWOT Designs
Some business contexts benefit from SWOT presentations that break from traditional quadrant formats. Creative four-petal SWOT templates and circular SWOT diagrams offer visually distinctive alternatives that can increase engagement in settings where audience attention is challenging to capture.

These creative formats work particularly well in innovation workshops, marketing presentations, or scenarios where demonstrating fresh thinking matters as much as the analysis itself. The non-traditional layout signals creative problem-solving while maintaining the analytical rigor of SWOT methodology.
Internal vs. External Factor Templates
For presentations emphasizing the distinction between controllable and environmental factors, internal vs external SWOT templates organize content around this conceptual divide rather than the traditional four-quadrant structure.

This format proves particularly valuable when strategic discussions center on resource allocation decisions, capability development priorities, or market responsiveness strategies. The visual separation reinforces strategic thinking about what organizations can directly influence versus what requires adaptive responses.
Blank and Customizable Frameworks
Organizations with unique analytical needs or specific branding requirements often benefit from starting with blank SWOT templates or empty SWOT frameworks that provide structure without predetermined content or styling.

These templates allow complete customization of labels, categories, visual elements, and organizational structure while maintaining the core SWOT framework. This flexibility supports specialized applications like departmental analyses, initiative evaluations, or scenario planning exercises.
Best Practices for Populating Strategic Content
The effectiveness of presentations depends not just on template selection but on how content within each quadrant is developed and articulated.
Prioritize Specificity Over Generic Statements
Generic entries like "strong brand" or "market competition" provide little actionable insight. Effective presentations use specific, evidence-based statements that stakeholders can evaluate and act upon.
Instead of "experienced team" as a strength, specify "15-year average tenure among senior leadership with proven track record in market downturns." Rather than listing "economic uncertainty" as a threat, articulate "projected 8-12% decline in customer spending capacity based on current inflation trends."
This specificity transforms analysis from abstract categorization into strategic intelligence that informs concrete decision-making.
Limit Entries to Maintain Focus
Overpopulated slides overwhelm audiences and dilute strategic focus. Research from the Harvard Business Review suggests that decision-makers process information more effectively when presented with curated priorities rather than exhaustive lists.
Aim for three to five high-impact entries per quadrant. If comprehensive analysis has identified more factors, consider creating tiered presentations with summary slides for main discussions and detailed appendices for reference.
Use Action-Oriented Language
Presentations gain impact when phrased in ways that suggest strategic implications. Frame strengths as competitive advantages, weaknesses as improvement priorities, opportunities as growth pathways, and threats as risks requiring mitigation strategies.
This action-oriented framing helps audiences move naturally from analysis to strategic response, making presentations more valuable for decision-making processes.
Support Claims with Data
Credible analysis backs assertions with evidence. When presenting market opportunities, include addressable market size, growth rates, or customer research findings. When identifying competitive threats, reference market share data, competitive intelligence, or industry trend analysis.
Data-supported presentations carry more weight in strategic discussions and withstand scrutiny better than assertion-based analyses.
Visual Design Principles for Strategic Analysis Slides
Beyond content quality, visual presentation significantly influences how audiences engage with strategic frameworks.
Maintain Visual Balance
Even when some quadrants contain more strategic importance than others, maintain visual balance across the framework. Uneven text distribution, inconsistent formatting, or disparate visual weight across quadrants creates perception of incomplete analysis.
If certain areas require more detailed discussion, consider using the main slide for high-level summary and creating dedicated deep-dive slides for priority areas.
Use Color Strategically
Color coding helps audiences quickly orient to different components. Many presentations use green for strengths and opportunities (positive factors) and red or orange for weaknesses and threats (concern areas).
However, consider your specific context. In some organizational cultures, red carries strong negative associations that may create unintended emotional responses. Alternative approaches include using organizational brand colors across all quadrants or employing neutral color schemes that let content speak for itself.
Incorporate Icons and Visual Elements
Well-chosen icons or simple graphics can make presentations more engaging and memorable. A magnifying glass might represent opportunities requiring investigation, while a shield could symbolize competitive strengths.
Use visual elements judiciously. The goal is enhanced clarity and engagement, not decorative complexity that distracts from strategic content.
Ensure Readability Across Viewing Contexts
Presentations must remain legible whether viewed on large conference room screens, laptop displays during video calls, or printed handouts. Test font sizes, contrast ratios, and visual hierarchies across different viewing scenarios before finalizing presentations.
Minimum recommended font size for content is 16-18 points for main entries, with larger sizing for quadrant labels and headings.
Customizing Templates in PowerPoint and Google Slides
Most professionals work with SWOT analysis template PPT files or Google Slides formats that require customization to fit specific organizational needs and presentation contexts.
Adapting Standard Templates
When working with a PowerPoint SWOT analysis template or free SWOT template, begin by updating color schemes to match organizational branding. Most templates built with native PowerPoint objects allow easy recoloring through format menus.
Next, adjust quadrant labels if needed. While standard terminology remains common, some contexts benefit from slight variations like "Competitive Advantages," "Improvement Areas," "Growth Potential," and "Market Risks."
Modify text placeholder sizing based on content volume. If analysis identifies fewer high-impact factors, increase font sizes for improved readability. If comprehensive detail is necessary, adjust spacing and formatting to accommodate additional content without creating visual clutter.
Adding Data Visualization Elements
Presentations often benefit from integrated charts, graphs, or metrics that provide evidence for analytical claims. PowerPoint and Google Slides both support insertion of charts, tables, and data visualizations within or alongside strategic frameworks.
Consider adding small bar charts showing competitive positioning metrics within the strengths quadrant, or trend lines illustrating market opportunity growth rates within the opportunities section. These integrated data elements strengthen analytical credibility.
Creating Multi-Slide Narratives
Rather than confining analysis to a single slide, consider developing multi-slide narratives that explore each quadrant in depth before synthesizing findings.
This approach works particularly well for comprehensive strategic reviews or board presentations where analysis forms the foundation for major decisions. Start with a summary SWOT template PowerPoint slide showing all four quadrants, then dedicate subsequent slides to detailed exploration of each component.
Linking Analysis to Strategic Actions
The most effective presentations don't end with analysis but connect findings to recommended actions. Create follow-up slides that show how identified strengths can be leveraged, how weaknesses will be addressed, which opportunities will be pursued, and how threats will be mitigated.
This strategic linkage transforms analysis from static evaluation into dynamic strategic planning that drives organizational action.
Common Presentation Mistakes to Avoid
Even with quality templates and solid analysis, certain presentation approaches undermine effectiveness.
Treating Analysis as the Final Deliverable
Strategic frameworks represent a starting point for strategic thinking, not an endpoint. Presentations that simply display findings without connecting to decisions, priorities, or action plans leave audiences wondering "so what?"
Always frame analysis within broader strategic narratives that explain implications and recommended responses.
Confusing Internal and External Factors
A surprisingly common error involves listing external factors as weaknesses or internal factors as threats. This category confusion undermines analytical clarity and can lead to misguided strategic responses.
Strengths and weaknesses should always describe internal organizational attributes. Opportunities and threats should always reference external market, competitive, or environmental conditions.
Neglecting to Update Analysis
Findings become outdated as markets evolve, competitive landscapes shift, and organizational capabilities develop. Presentations using analysis created months or years earlier risk basing decisions on obsolete information.
Date analyses clearly and commit to regular updates that reflect current realities.
Moving From Analysis to Strategic Action
The ultimate value of strategic frameworks lies not in the analysis itself but in actions that follow. Effective presentations bridge the gap between analytical findings and organizational commitments.
When presenting strategic analysis, clearly articulate how findings inform priorities, resource allocation decisions, capability development plans, and risk mitigation approaches. Connect each dimension to specific initiatives, investments, or organizational changes.
Document commitments that emerge from strategic discussions. Who will address identified weaknesses? How will the organization pursue highlighted opportunities? What resources are allocated to threat mitigation? These concrete follow-through mechanisms ensure presentations drive actual strategic impact rather than remaining theoretical exercises.
For organizations regularly using strategic frameworks, SlideKit offers professionally designed templates that reduce preparation time while maintaining presentation quality. Having access to various template formats allows teams to select appropriate designs for different strategic contexts without starting from scratch each time.
Whether presenting to executive leadership, department teams, or external stakeholders, best practices for using SWOT analysis in business presentations center on clarity, specificity, visual professionalism, and clear linkage to strategic action. Thoughtful template selection, evidence-based content development, and strategic presentation design transform planning tools into powerful communication frameworks that drive meaningful business decisions and organizational alignment.
See more

