
Swimlane Diagram Explained: Definition & Benefits
Businesses often rely on multiple teams, departments, and systems to complete a single process. Without a clear view of who is responsible for each task, workflows can become confusing, inefficient, and prone to delays. This is where a Swimlane Diagram becomes an essential process mapping tool.
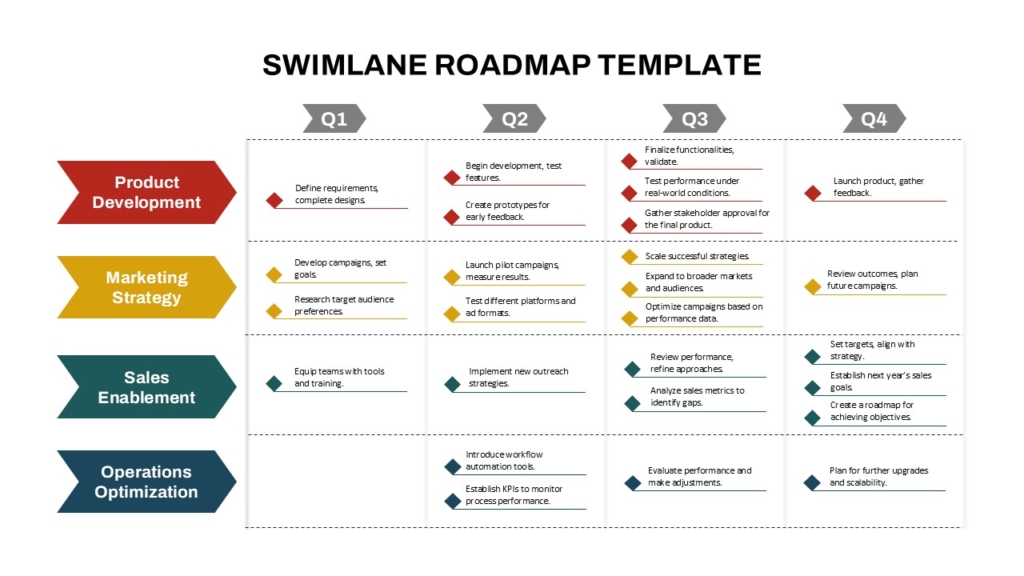
A Swimlane Diagram visually organizes workflow steps into separate lanes representing departments, roles, or individuals. By clearly defining responsibilities and showing how tasks move between teams, it helps organizations improve collaboration, streamline operations, and identify bottlenecks.
Whether you’re documenting business processes, managing projects, improving customer service, or optimizing operational workflows, Swimlane Diagrams provide a structured way to visualize complex processes.
In this guide, you’ll learn what a Swimlane Diagram is, how it works, its key components, benefits, real-world examples, and best practices for creating effective workflow diagrams.
What Is a Swimlane Diagram?
A Swimlane Diagram is a type of flowchart that divides a process into horizontal or vertical lanes. Each lane represents a participant involved in the workflow, such as a department, team, employee, or software system.
Unlike a standard flowchart, a Swimlane Diagram not only shows the sequence of activities but also identifies who is responsible for each task.
This makes it an ideal tool for documenting cross-functional processes where multiple stakeholders collaborate to complete a workflow.
Why is it called a Swimlane Diagram?
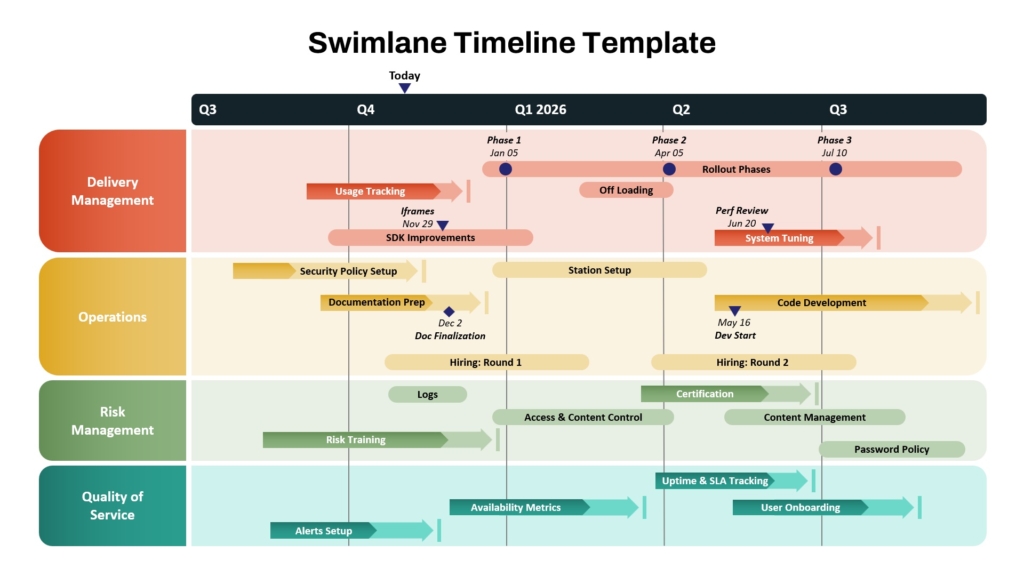
The diagram gets its name because its layout resembles the lanes in a swimming pool.
Each lane represents:
- A department
- A team
- An employee
- A business function
- A software system
Activities are placed inside their respective lanes, making it easy to understand ownership and workflow progression.
Why Use a Swimlane Diagram?
Swimlane Diagrams provide much more than a visual process map. They help organizations improve efficiency and collaboration by clearly showing how work flows across different teams.
Key benefits include:
- Clearly defines responsibilities
- Improves communication between departments
- Simplifies complex workflows
- Identifies process bottlenecks
- Reduces duplicate work
Key Components of a Swimlane Diagram
Understanding the basic elements of a Swimlane Diagram helps you create more effective process maps.
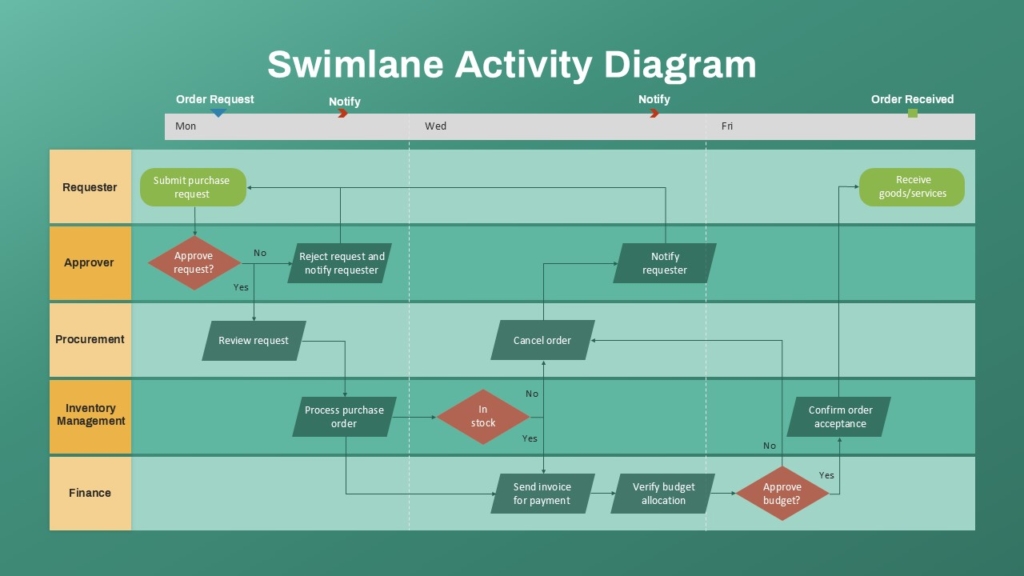
- Swimlanes
The lanes represent participants responsible for completing tasks.
Examples : Sales, Marketing, HR, Finance, IT, Customer Support
- Process Steps
These represent individual activities performed during the workflow.
Examples : Receive customer request, Review application, Approve payment
- Decision Points
Decision diamonds show where the process branches based on conditions.
- Connectors
Arrows indicate the direction of the workflow and show how tasks move from one participant to another.
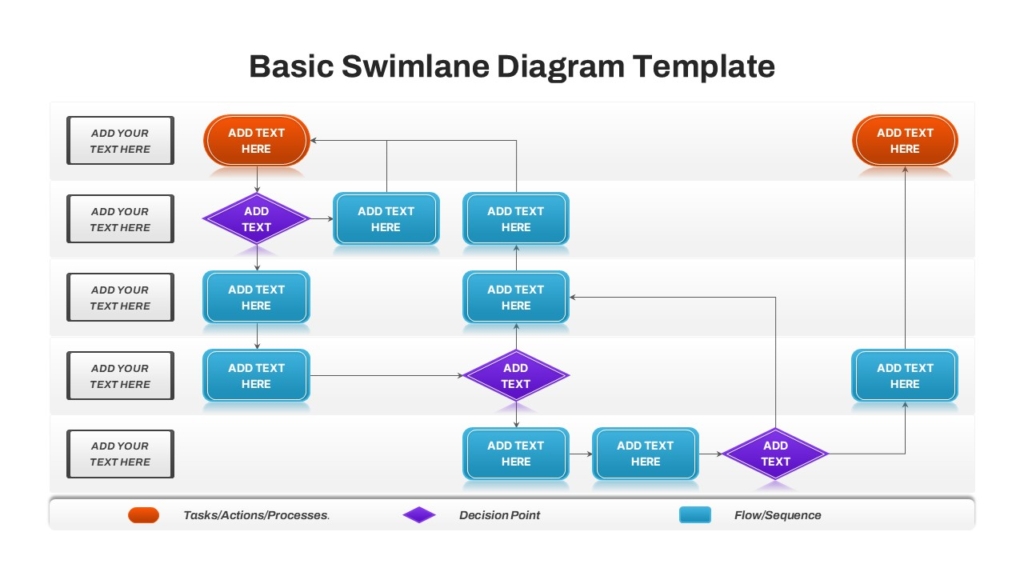
- Start and End Points
Every Swimlane Diagram should clearly define where the process begins and ends.
Benefits of Swimlane Diagrams
Improves Collaboration : Everyone understands their responsibilities and how their work connects with others.
Identifies Bottlenecks : Cross-functional handoffs become easier to analyze and improve.
Increases Efficiency : Organizations can eliminate unnecessary approvals and duplicate work.
Simplifies Presentations : Visual workflows are easier for stakeholders to understand than text-heavy documentation.
Common Business Applications
Swimlane Diagrams are widely used across industries.
- Project Management: Visualize responsibilities, project phases, approvals, and deliverables.
- Human Resources: Document recruitment, onboarding, performance reviews, and employee lifecycle processes.
- Healthcare: Map patient admissions, treatment workflows, and discharge procedures.
- Finance: Illustrate invoice approvals, expense reimbursements, and payment processing.
- Customer Service: Track support requests, escalations, and resolution processes.
Conclusion
Swimlane Diagrams are one of the most effective tools for visualizing business processes involving multiple teams, departments, or systems. By clearly assigning responsibilities and illustrating how work flows between participants, they improve communication, reduce bottlenecks, and streamline operations. Whether you’re documenting workflows, managing projects, optimizing customer service, or standardizing internal processes, Swimlane Diagrams provide a clear and structured approach to process mapping. Using editable templates can further simplify the design process and help you create professional presentations with minimal effort.
Create Professional Swimlane Diagram Presentations with SlideKit
Need to present workflows with clarity and professionalism? SlideKit offers a premium collection of Swimlane Diagram Templates for PowerPoint and Google Slides designed to help you map business processes, define responsibilities, and visualize cross-functional workflows. Our fully editable templates include modern layouts, customizable swimlanes, flowchart symbols, icons, and infographic elements, making them ideal for project management, HR, finance, operations, healthcare, and business process improvement presentations.
👉Explore SlideKit’s Swimlane Diagram Templates today and create clear, engaging workflow presentations in minutes.