Sales Funnel Infographic Ideas for Businesses
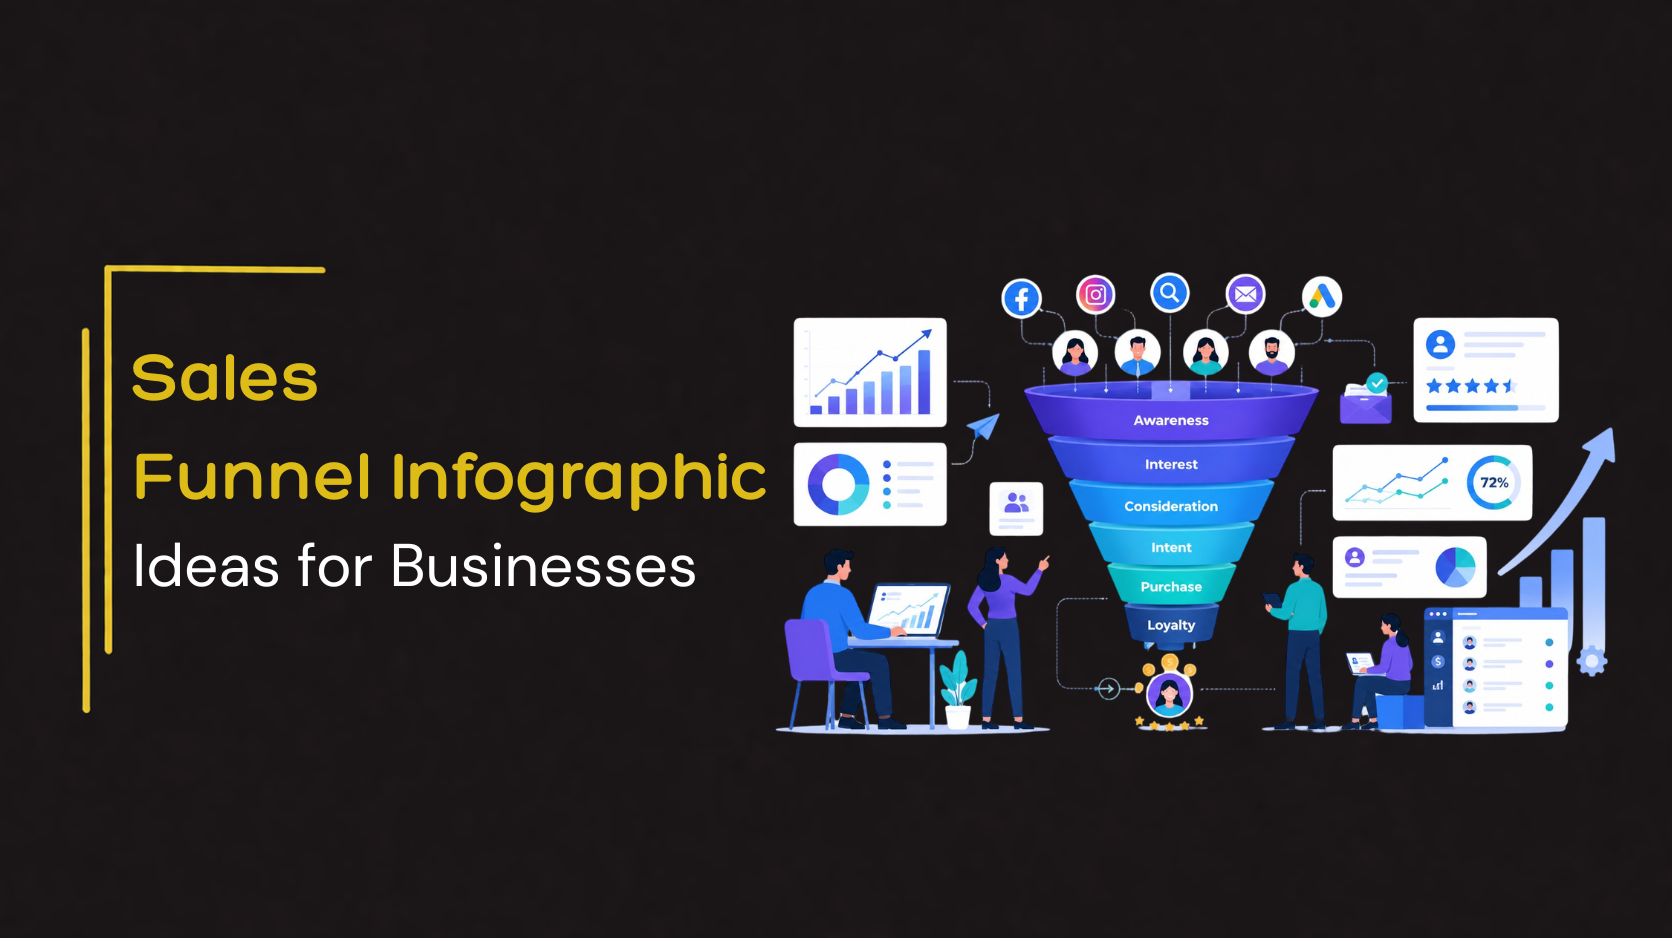
In today’s competitive market, businesses need a clear way to visualize the customer journey and communicate marketing strategies effectively. A sales funnel infographic is one of the most powerful tools for presenting how prospects move from initial awareness to becoming loyal customers. Whether you’re creating a marketing report, sales presentation, business proposal, or training session, a well-designed sales funnel infographic simplifies complex processes and helps stakeholders understand key conversion stages.
This guide explores practical sales funnel infographic ideas that businesses can use to improve communication, track performance, and optimize customer acquisition strategies.
What is a Sales Funnel Infographic?
A sales funnel infographic is a visual representation of the stages customers go through before making a purchase. The funnel narrows as potential customers move through different stages, highlighting how leads are filtered and converted into paying customers.
A typical sales funnel consists of several stages, including awareness, interest, consideration, intent, evaluation, purchase, retention, and advocacy. Each stage represents a step in the customer journey, helping businesses understand how prospects move from discovering a product or service to becoming loyal advocates. Using infographic designs to visualize these stages makes the sales process easier to understand while highlighting customer behavior, conversion opportunities, and areas for improvement.
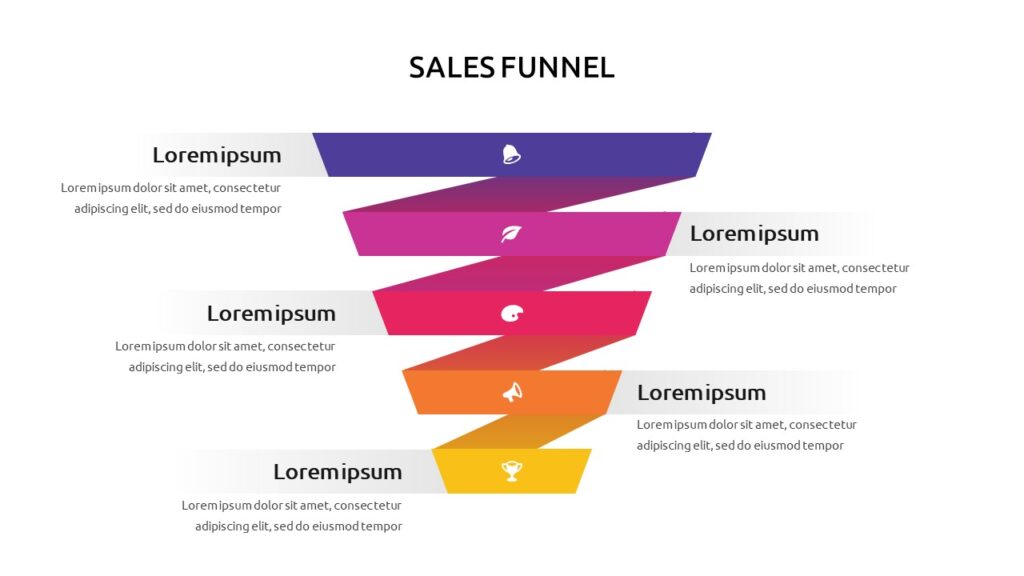
1. Traditional Sales Funnel Infographic
The classic funnel design remains one of the most effective options for business presentations.
Ideal Use Cases :
- Marketing strategy presentations
- Lead generation reports
- Business planning meetings
- Investor presentations
A sales funnel infographic typically features a wide top representing audience reach that gradually narrows through each stage of the customer journey. It often includes conversion percentages, lead counts, and marketing channel indicators, making it easy to visualize how prospects move through the sales process and identify where drop-offs occur.
👉Get free Sales Funnel Infographic Template on SlideKit
2. Digital Marketing Funnel Infographic
Businesses running online campaigns can use a digital marketing funnel infographic to showcase customer acquisition channels.
Funnel Stages:
- Social Media Awareness
- Website Visits
- Content Engagement
- Lead Capture
- Email Nurturing
- Sales Conversion
This infographic is particularly useful for digital marketing agencies and online businesses. It helps businesses track campaign performance, identify traffic sources, visualize customer acquisition costs, and uncover conversion optimization opportunities, making it easier to improve marketing effectiveness and drive better results.
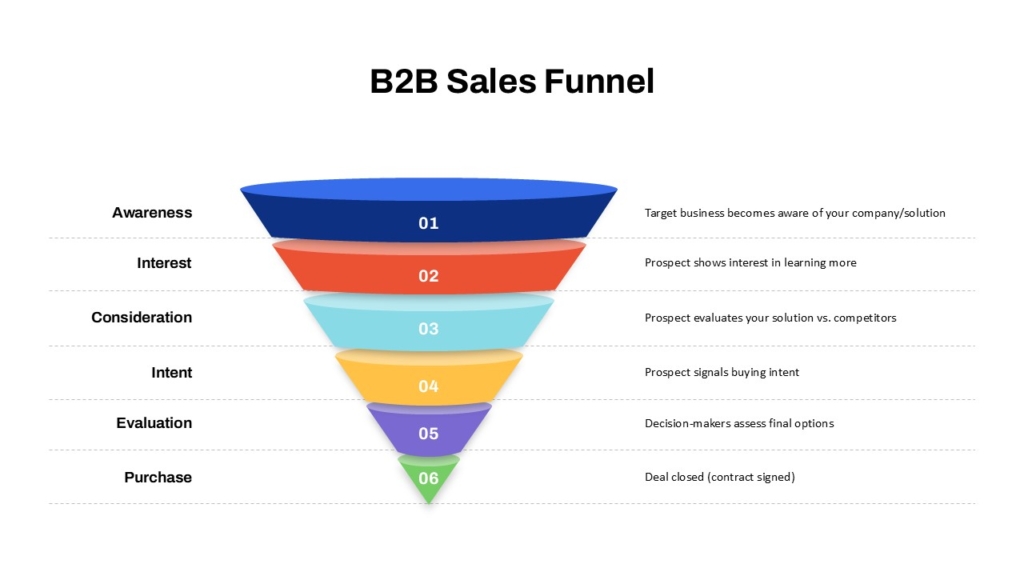
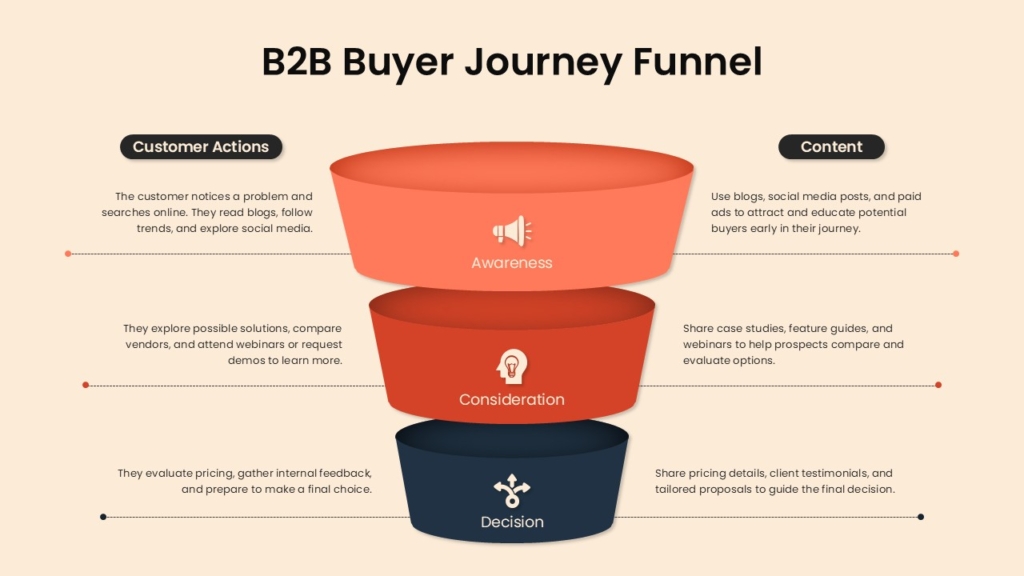
3. B2B Sales Funnel Infographic
B2B sales cycles are often more complex than consumer purchases. A dedicated B2B funnel infographic helps visualize longer decision-making processes.
Common Stages:
- Prospect Identification
- Initial Contact
- Qualification
- Product Demonstration
- Proposal Submission
- Negotiation
- Closing
Including average deal size and sales cycle length can make the infographic even more informative.
Best for : Sales team presentation, CRM reporting, Revenue forecasting, Account management reviews
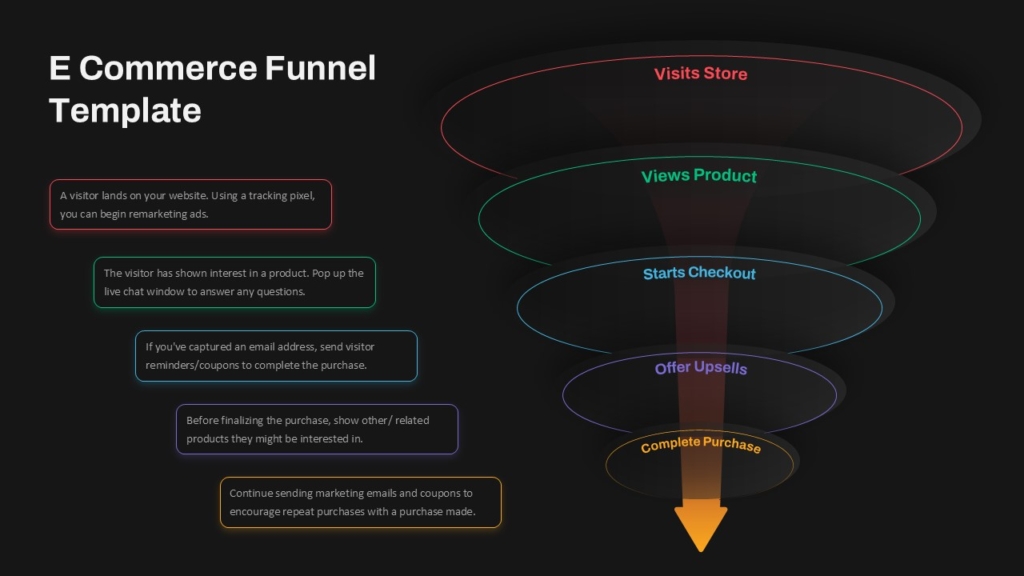
4. E-Commerce Conversion Funnel
Online retailers can benefit from funnel infographics that focus specifically on customer purchase behavior.
Funnel Example:
- Product Impressions
- Product Views
- Add to Cart
- Checkout Initiated
- Purchase Completed
This infographic helps identify bottlenecks in the online shopping experience. Key metrics to include in a sales funnel infographic are cart abandonment rates, conversion percentages, revenue generated, and customer retention statistics. These metrics provide valuable insights into sales performance, customer behavior, and overall funnel effectiveness.
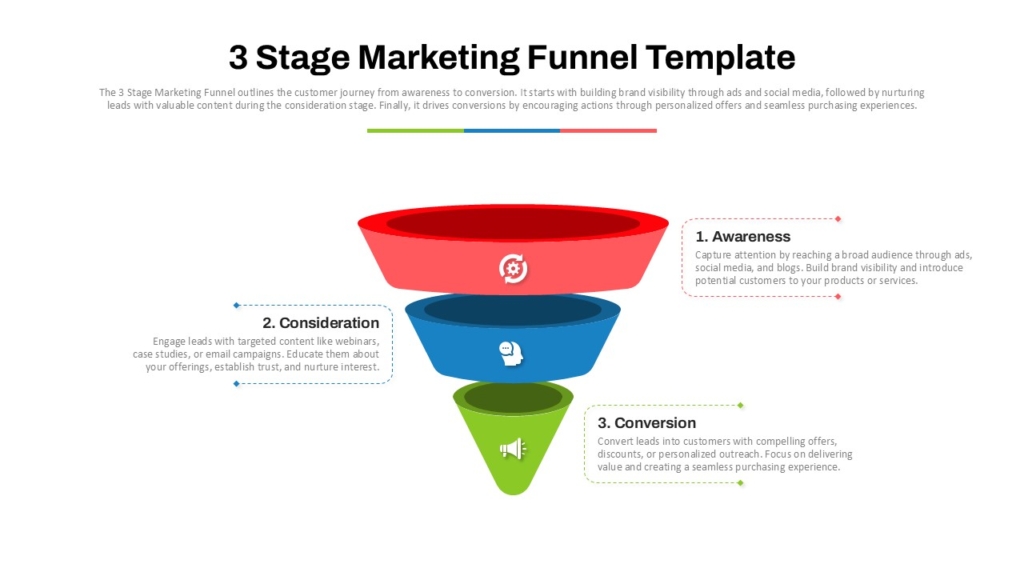
5. Customer Journey Funnel Infographic
Modern businesses often combine customer journey mapping with funnel visualization.
Stages: Awareness, Research, Evaluation, Purchase, Experience, Loyalty, Advocacy.
A customer journey funnel infographic provides customer-centric insights, helps improve user experience planning, supports retention strategies, and aligns sales and marketing teams around a shared understanding of the customer journey. Adding customer emotions and touchpoints can create a more engaging presentation.
Why Businesses Use Sales Funnel Infographics
Sales funnel infographics provide more than just visual appeal. They help organizations:
- Simplify complex sales processes
- Track performance metrics
- Support strategic decision-making
- Enhance marketing and sales alignment
- Present data more effectively
Whether used internally or externally, funnel infographics make business information easier to understand and act upon.
Create Professional Sales Funnel Presentations with SlideKit
Looking for professionally designed Sales Funnel PowerPoint Templates and Google Slides Themes?
Explore SlideKit’s collection of editable sales funnel infographic templates to create impactful presentations in minutes. Whether you’re presenting marketing performance, lead generation strategies, customer journeys, or business growth plans, SlideKit offers modern, customizable templates designed to help you communicate ideas clearly and professionally.
👉Browse SlideKit Sales Funnel Templates today and turn complex data into compelling visual stories.

