
PowerPoint Charts: A Complete Overview Guide
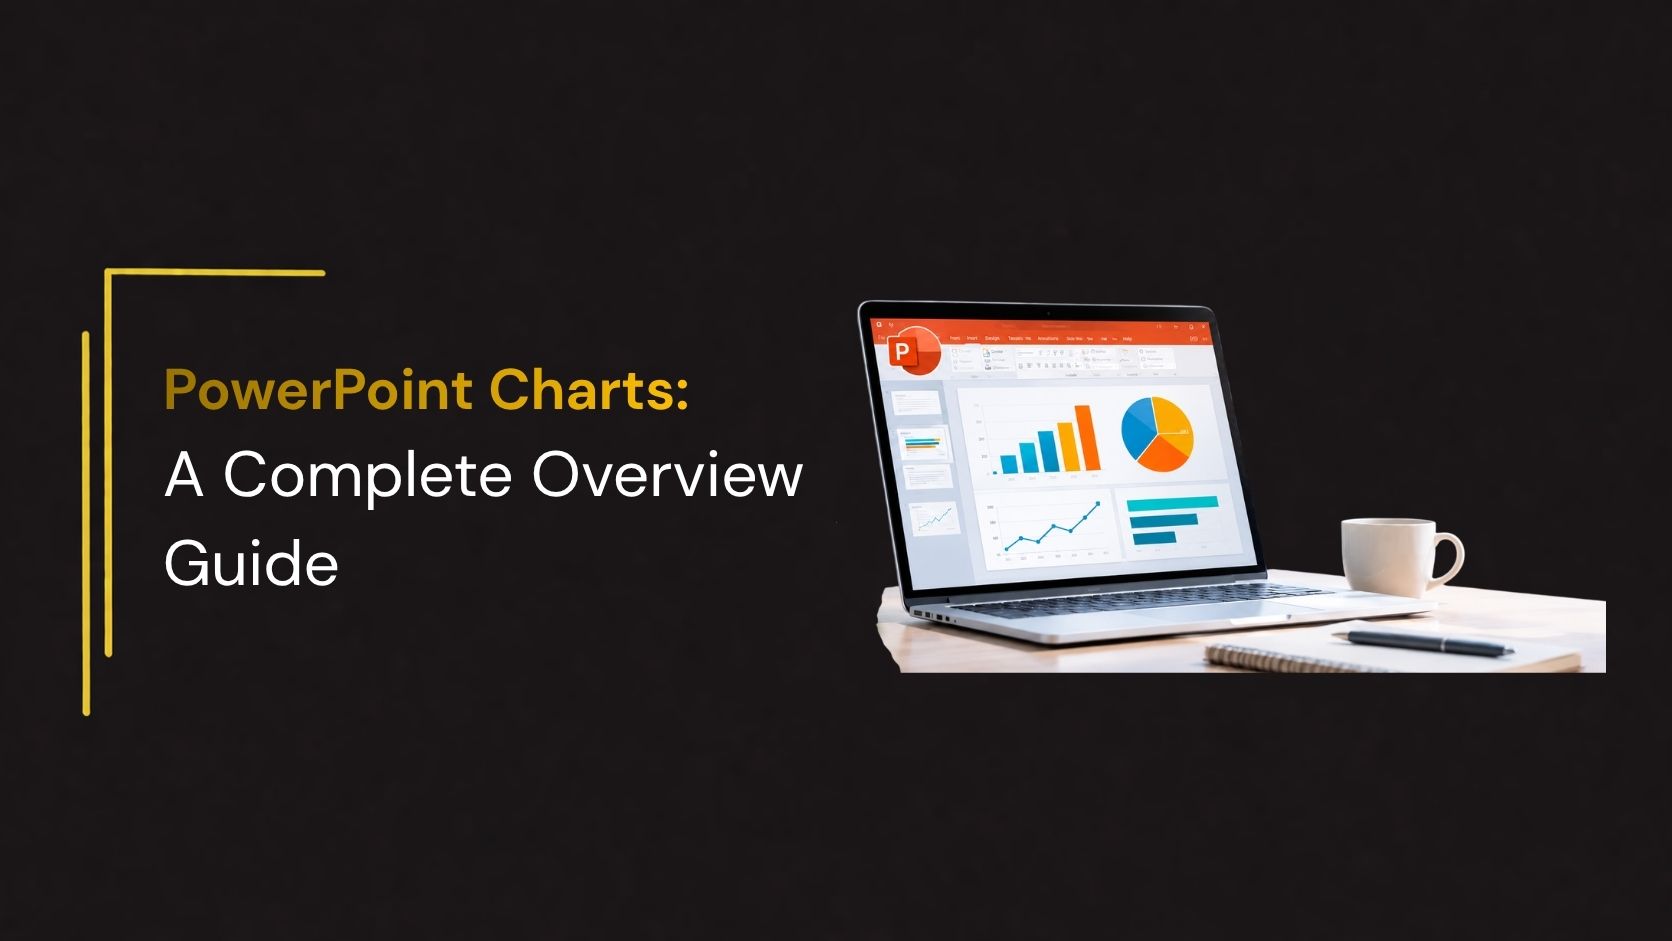
Data plays an important role in business presentations, reports, project updates, and strategic planning. However, presenting large amounts of information through text and numbers alone can make it difficult for audiences to understand key findings. PowerPoint charts offer a visual way to organize data, highlight patterns, compare values, and communicate important insights.
Whether you are preparing a business presentation, financial report, marketing analysis, sales review, or academic project, choosing the right chart can make your information easier to understand. PowerPoint provides several chart options, including bar charts, line charts, pie charts, area charts, scatter plots, and combination charts.
This guide explains the different types of PowerPoint charts, their uses, how to create and customize them, and practical tips for presenting data effectively.
What Are PowerPoint Charts?
PowerPoint charts are visual representations of numerical information used to communicate data within presentations. They transform spreadsheets and statistical figures into graphical formats that help audiences identify comparisons, trends, proportions, and relationships.
For example, a sales report containing monthly revenue figures can be presented through a column chart to show performance across different months. Similarly, a pie chart can illustrate how a company’s budget is distributed across departments.
Charts can be created directly in PowerPoint or prepared in Excel and added to a presentation. PowerPoint also provides editing options for chart elements, including titles, axes, legends, data labels, colors, and styles.
Different Types of PowerPoint Charts and Their Uses
PowerPoint offers different chart formats for different data requirements. Selecting the right type depends on the information being presented and the message you want your audience to understand.
1. Column Charts
Column charts use vertical rectangular bars to compare values across different categories. Each column represents a category, while its height corresponds to the associated value.
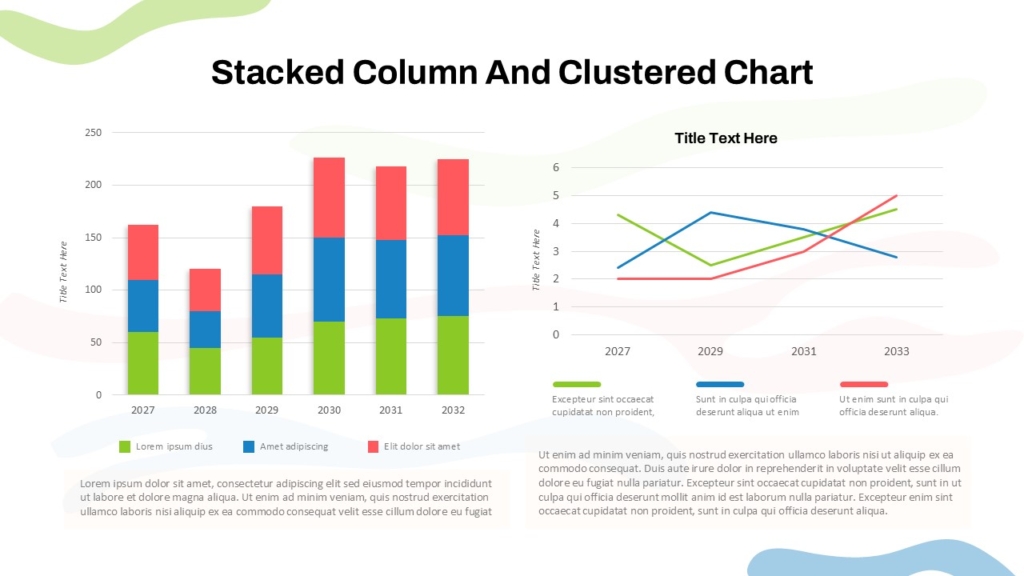
Common uses:
- Comparing monthly or annual sales performance.
- Presenting revenue across business departments.
- Measuring product performance.
- Comparing employee productivity.
- Displaying quarterly business results.
2. Bar Charts
Bar charts display information using horizontal bars. They are useful when comparing multiple categories, particularly when category names are long.
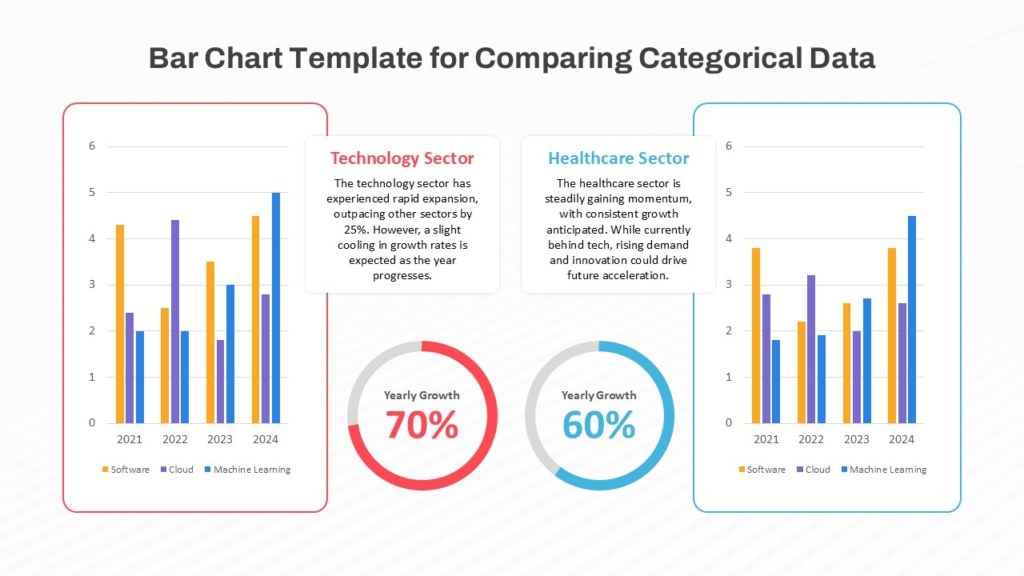
Common uses:
- Comparing product sales.
- Ranking business performance.
- Displaying customer satisfaction scores.
- Comparing regional revenue.
- Presenting survey results.
3. Pie Charts
Pie charts represent a total as separate slices. Each slice illustrates the proportion contributed by a particular category.
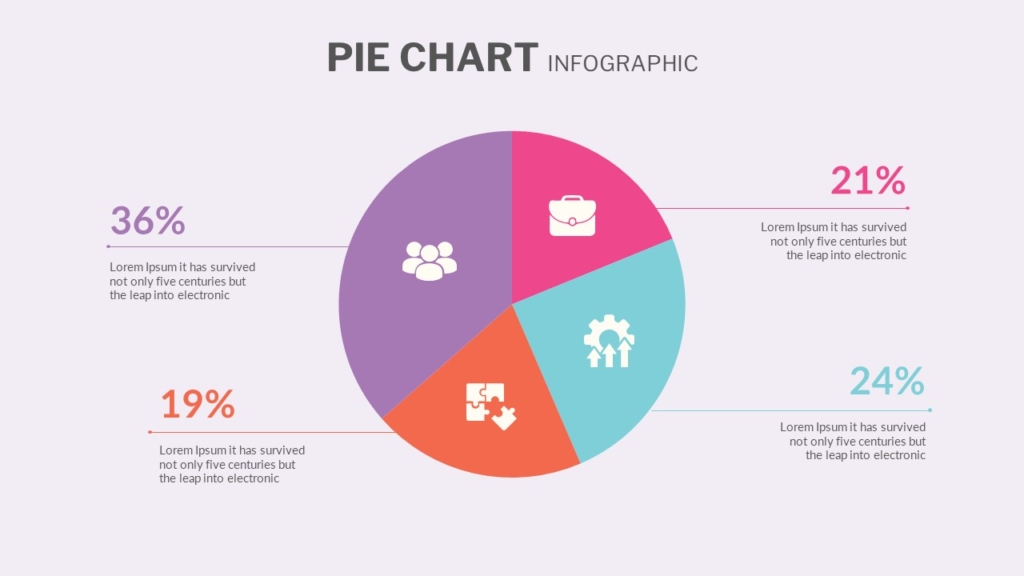
Common uses:
- Displaying budget allocation.
- Showing market share.
- Presenting customer demographics.
- Comparing expense categories.
- Illustrating survey responses.
4. Radar Charts
Radar charts display multiple variables on axes that extend from a central point. They help compare several categories or performance dimensions within the same visual.
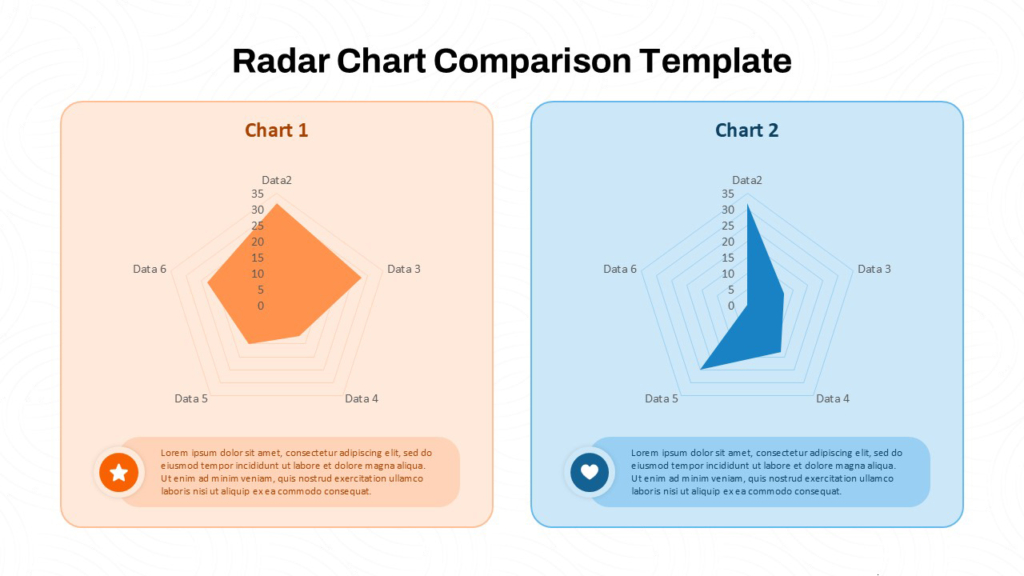
Common uses:
- Comparing employee skill sets.
- Evaluating product features.
- Measuring business capabilities.
- Assessing competitor performance.
- Presenting organizational performance indicators.
5. Funnel Charts
Funnel charts represent values across different stages of a process. They are particularly useful when quantities decrease as they move from one stage to another.
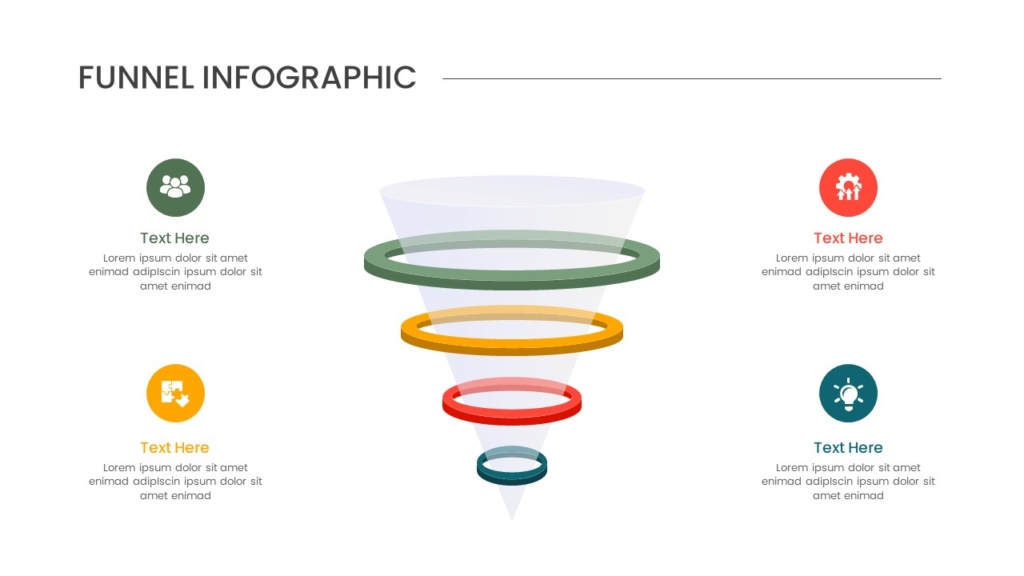
Common uses:
- Visualizing sales pipelines.
- Tracking marketing conversions.
- Monitoring customer acquisition.
- Presenting recruitment stages.
- Evaluating lead generation performance.
6. Waffle Charts
Waffle charts use a grid of equally sized squares to represent proportions or percentages of a whole. Each square represents a specific unit, making it easy to visualize progress, completion rates, market share, and resource allocation.
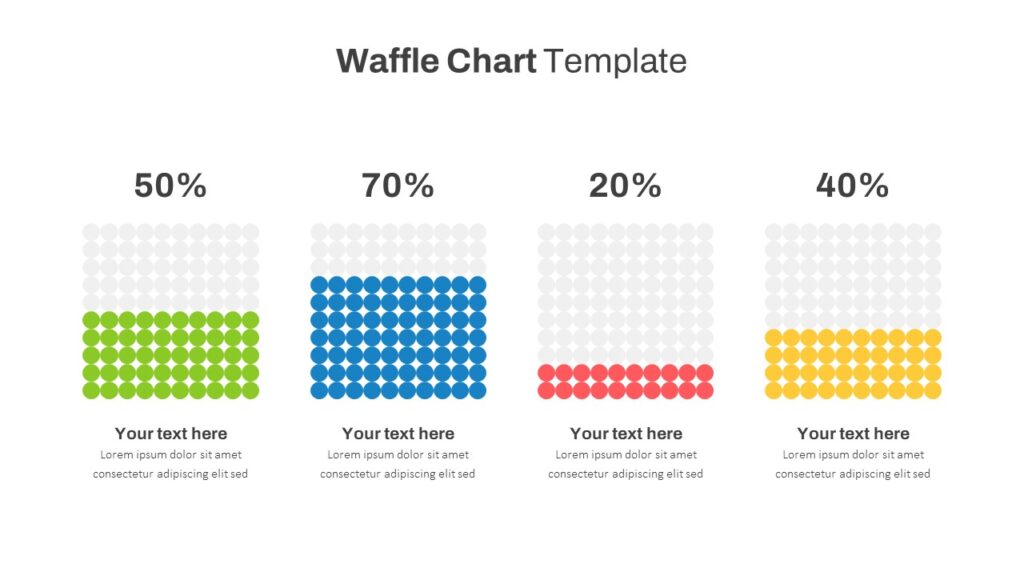
Common uses:
- Displaying project completion percentages.
- Showing market share distribution.
- Tracking business performance targets.
- Presenting survey results.
- Visualizing budget allocation.
7. Donut Chart
Donut charts are similar to pie charts but contain an empty space in the center. They display how individual categories contribute to a total and can accommodate multiple data series as separate rings.
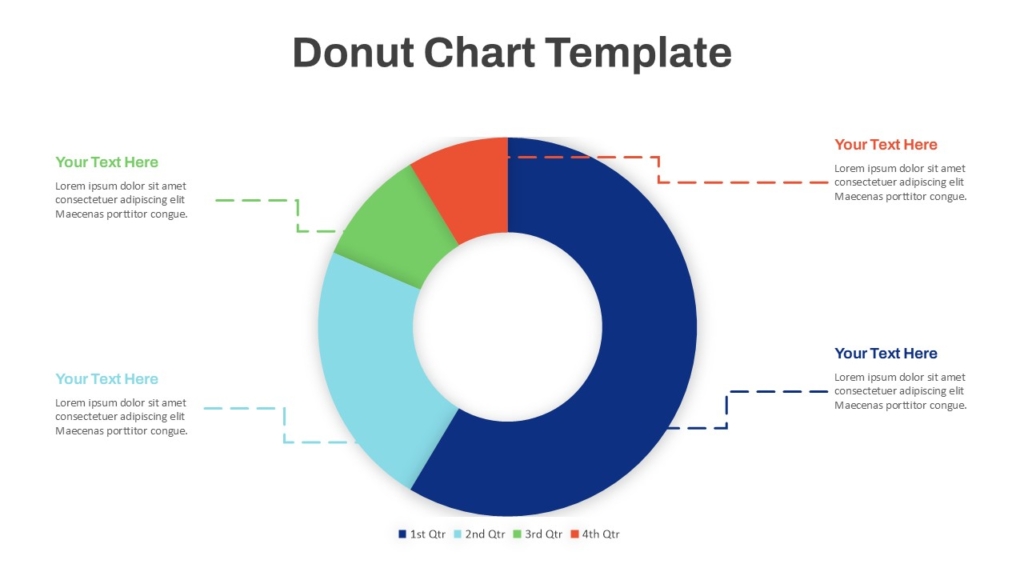
Common uses:
- Presenting departmental budget distribution.
- Showing customer segmentation.
- Displaying project completion percentages.
- Comparing business resource allocation.
How to Customize PowerPoint Charts for Professional Presentations
A chart should communicate information clearly while maintaining the visual consistency of the presentation. Customization helps make data more readable and gives slides a professional appearance.
- Use Consistent Colors : Choose a limited color palette that matches your presentation theme. Use contrasting colors when you need to distinguish between categories or highlight important values.
- Keep Labels Readable : Use clear fonts and appropriate text sizes for chart titles, axis labels, and data values. Avoid overcrowding the chart with unnecessary labels.
- Highlight Important Data : Use a contrasting color or annotation to emphasize the most important value, trend, or category. This helps audiences focus on the main finding.
- Remove Unnecessary Elements : Too many gridlines, borders, legends, and decorative effects can distract from the data. Keep only the elements that help explain the information.
- Add Context to Your Charts : A chart title should communicate what the data represents. Add a short explanation or takeaway when the visual alone does not provide enough context.
Conclusion
PowerPoint charts make it easier to communicate numerical information, compare business performance, identify trends, and explain important findings. From simple bar charts and line graphs to advanced waterfall, funnel, and combination charts, each format serves a different data visualization purpose.
Selecting the right chart, organizing information clearly, and maintaining consistent formatting can improve the overall quality of your presentation. Whether you are preparing a financial report, business review, marketing analysis, or management dashboard, effective chart design helps turn data into meaningful insights.
Where to Find Professional PowerPoint Chart Templates
Creating every chart layout from scratch can take time, particularly when preparing business reports, financial presentations, marketing reviews, or management dashboards.
Ready-made presentation resources can help simplify the design process. SlideKit offers a collection of PowerPoint templates and presentation resources that can help users create organized, visually engaging slides.
👉Explore SlideKit PowerPoint Templates to find presentation designs for business reports, data visualization, charts, and professional presentations.