
Fishbone Diagram Explained
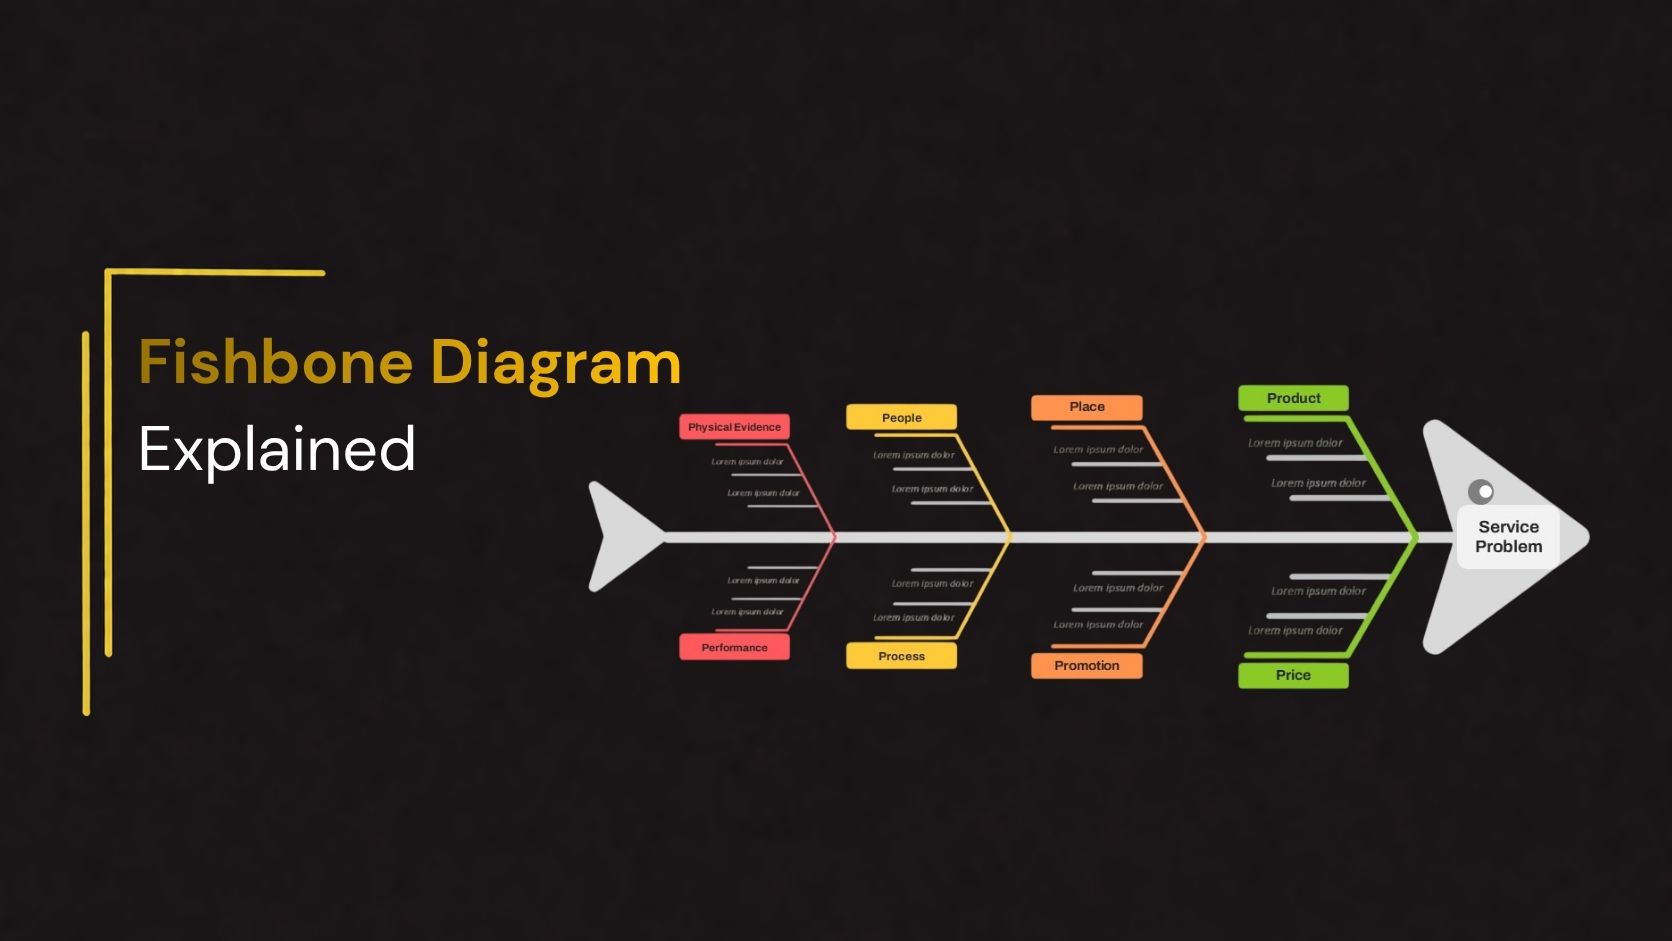
Identifying the root cause of a problem is essential for making effective business decisions. Whether you’re facing production delays, customer complaints, project risks, or quality issues, solving the underlying cause, not just the symptoms, leads to better long-term results. One of the most widely used tools for root cause analysis is the Fishbone Diagram, also known as the Ishikawa Diagram or Cause-and-Effect Diagram.
A Fishbone Diagram helps teams visually organize potential causes of a problem, making brainstorming more structured and collaborative. It is commonly used in quality management, project management, Lean Six Sigma, healthcare, manufacturing, education, and business operations.
In this guide, you’ll learn what a Fishbone Diagram is, how it works, its key components, real-world examples, benefits, and best practices for creating one.
What Is a Fishbone Diagram?
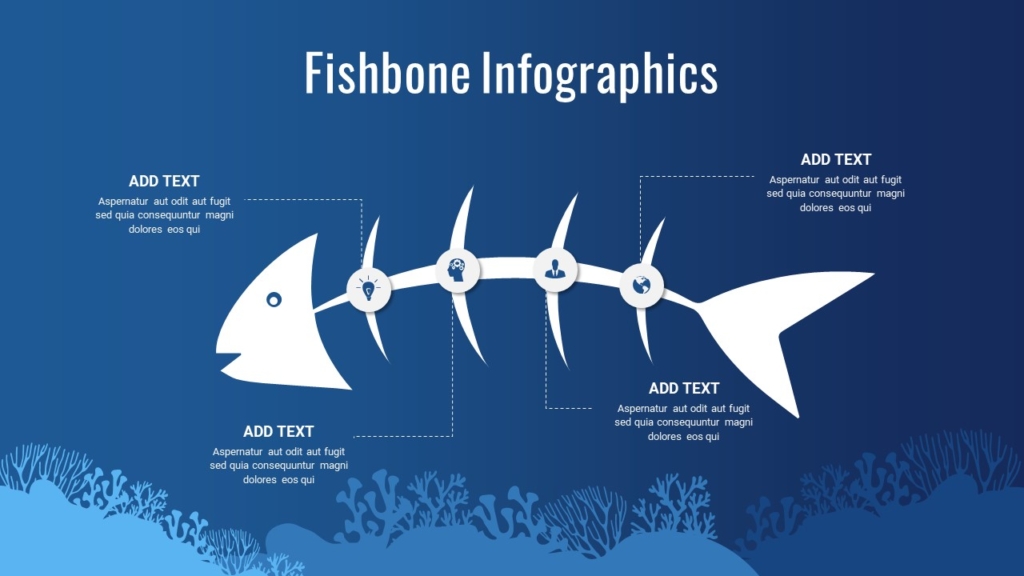
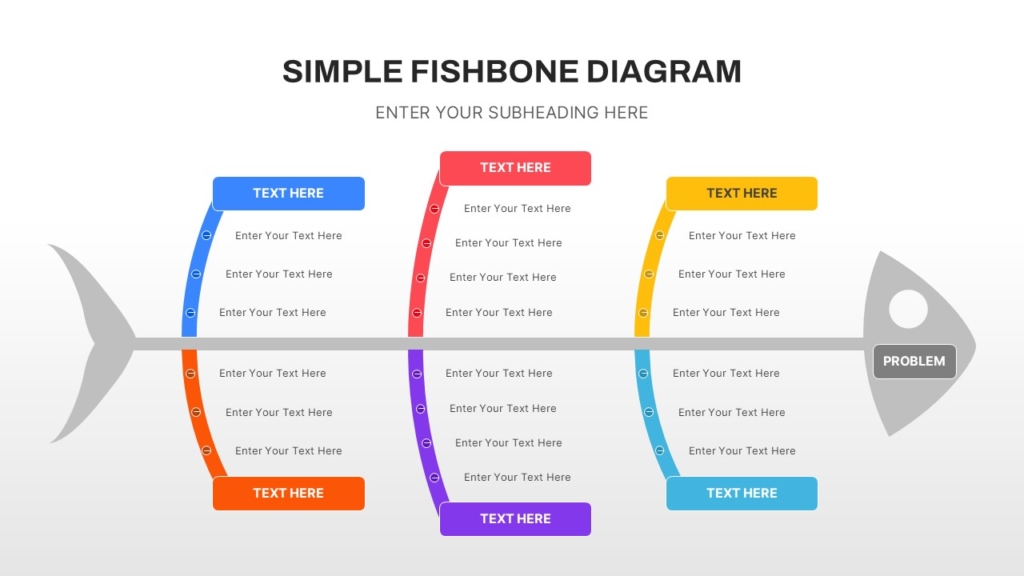
A Fishbone Diagram is a visual problem-solving tool that helps identify all possible causes of a specific issue. Its structure resembles a fish skeleton, with the problem statement forming the “head” and the possible causes branching out as “bones.”
The diagram was developed by Dr. Kaoru Ishikawa, a Japanese quality management expert, to improve quality control processes. Today, it is widely used across industries to support systematic problem-solving and continuous improvement.
The main objective of a Fishbone Diagram is to identify root causes rather than simply addressing visible symptoms.
Why Is It Called a Fishbone Diagram?
The name comes from its distinctive appearance.
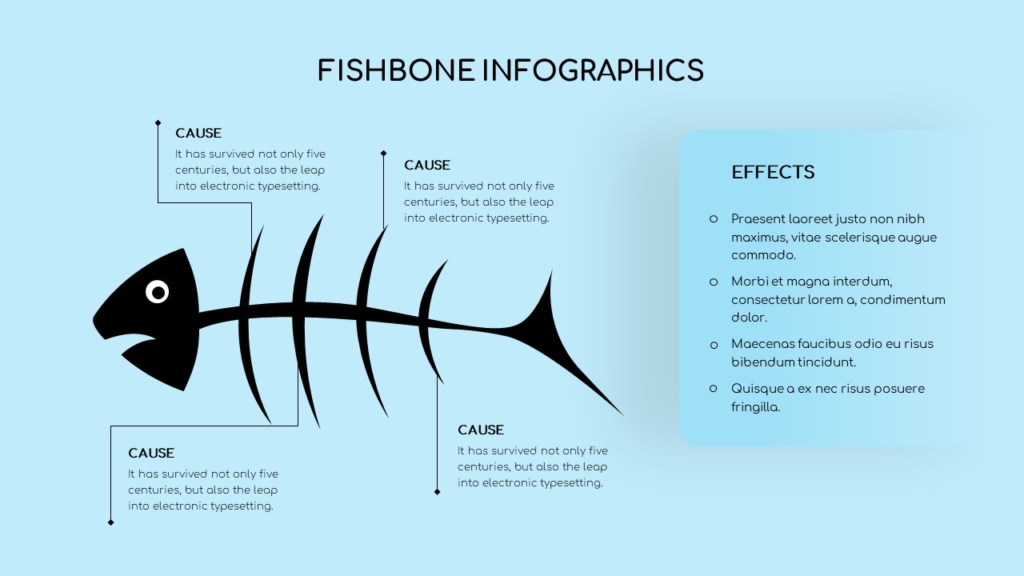
A typical Fishbone Diagram includes:
- Head: The problem or effect being analyzed
- Spine: The central line connecting all causes
- Major Bones: Main categories of possible causes
- Smaller Bones: Sub-causes and contributing factors
This structure helps teams organize ideas logically and uncover relationships between different factors.
How Does a Fishbone Diagram Work?
The Fishbone Diagram follows a structured approach to root cause analysis.
- Step 1: Define the Problem
Clearly identify the issue you want to investigate.
- Step 2: Identify Major Cause Categories
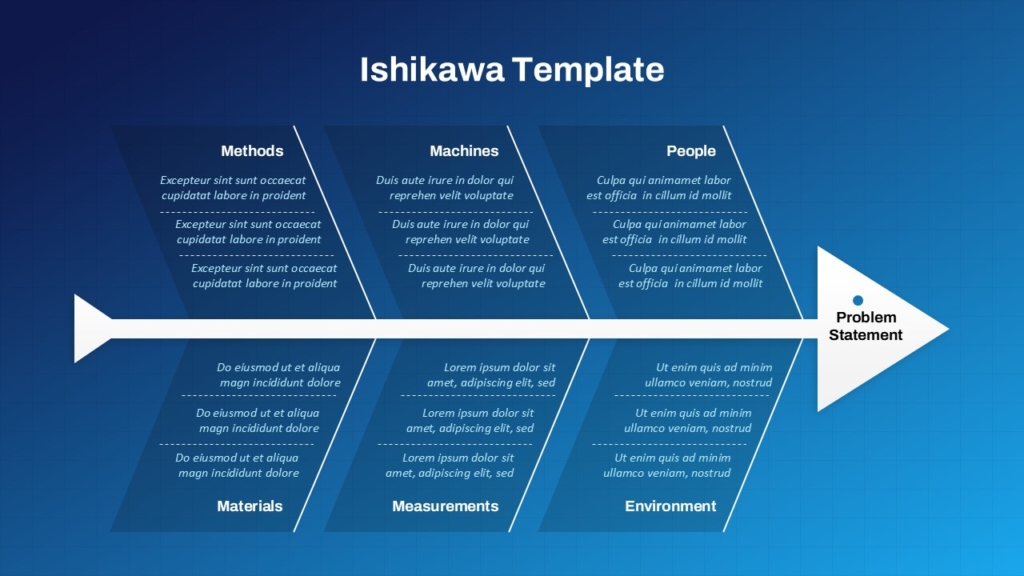
Most organizations use standard categories such as:
- People
- Process
- Equipment
- Materials
- Environment
- Measurement
Service industries may replace some categories with Technology, Policies, or Communication.
- Step 3: Brainstorm Possible Causes
For each category, list all possible factors contributing to the problem.
- Step 4: Analyze Root Causes
Review the completed diagram to identify the most likely root causes supported by evidence.
The goal is to prioritize actions that address the underlying issues rather than temporary fixes.
Benefits of Using a Fishbone Diagram
Fishbone Diagrams offer several advantages:
- Encourages structured brainstorming
- Identifies multiple contributing factors
- Improves collaboration across teams
- Simplifies complex problem analysis
- Supports data-driven decision-making
- Reduces recurring issues
- Enhances continuous improvement initiatives
Because the diagram organizes information visually, it is easier for stakeholders to understand and discuss potential causes.
Where Are Fishbone Diagrams Commonly Used?
Fishbone Diagrams are valuable across many industries.
- Business Operations : Improve workflows and operational efficiency.
- Manufacturing : Reduce defects and improve production quality.
- Healthcare : Enhance patient care and streamline clinical processes.
- Project Management : Identify project risks and delivery challenges.
- Education : Analyze learning outcomes and classroom issues.
- Customer Service : Investigate recurring customer complaints and service delays.
Conclusion
A Fishbone Diagram is one of the most effective tools for identifying the root causes of complex problems. By organizing potential causes into clear categories, it helps teams move beyond assumptions and focus on evidence-based solutions. Whether you’re improving product quality, managing projects, enhancing customer service, or optimizing business processes, using real-world Fishbone Diagram examples can simplify analysis and support better decision-making. When applied correctly, this visual framework encourages collaboration, uncovers hidden issues, and drives continuous improvement across organizations.
Need to present root cause analysis clearly and professionally? SlideKit offers a wide collection of Fishbone Diagram PowerPoint Templates and Google Slides Themes designed for quality management, project planning, business analysis, healthcare, education, and process improvement. Our fully editable templates feature modern layouts, customizable colors, icons, and infographic elements, making it easy to create impactful presentations without starting from scratch.
👉Explore SlideKit Fishbone Diagram Templates and transform complex problem analysis into clear, engaging presentations.