
Dashboard vs Scorecard: What’s the Difference
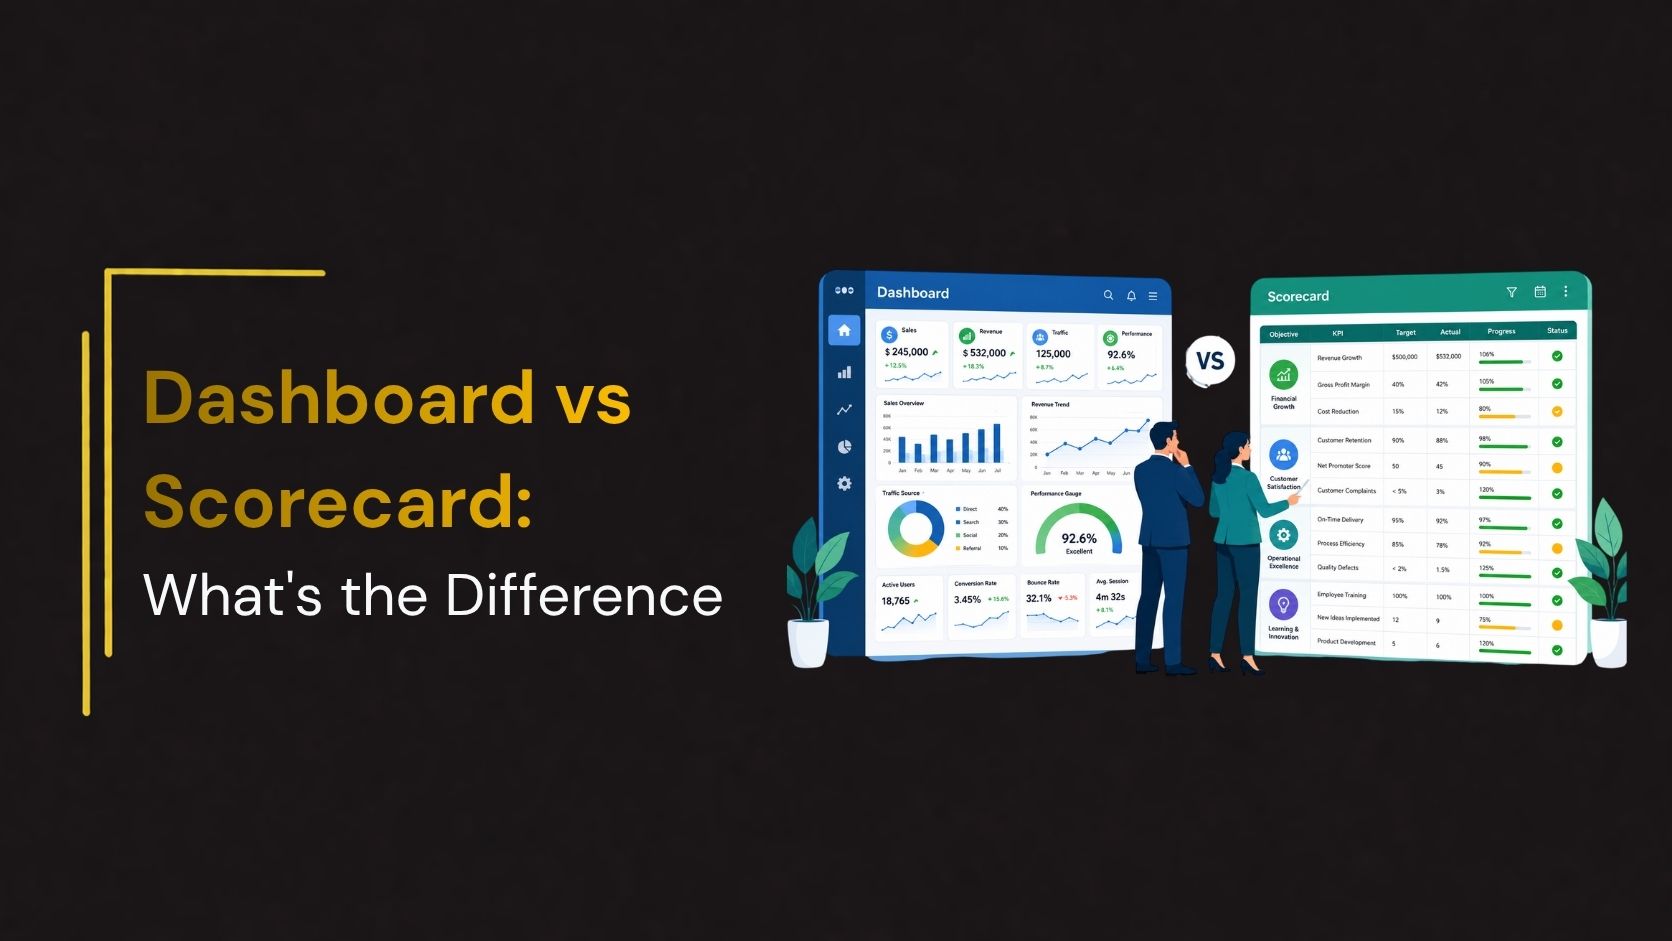
Organizations rely on data to monitor performance, make informed decisions, and achieve strategic goals. Two of the most widely used business performance management tools are dashboards and scorecards. While these terms are often used interchangeably, they serve different purposes and provide different insights.
A dashboard focuses on monitoring real-time or operational data, helping teams track ongoing activities and respond quickly to changes. A scorecard, on the other hand, measures progress toward strategic objectives by comparing performance against predefined goals and targets.
Understanding the differences between dashboards and scorecards can help businesses choose the right reporting tool for executives, managers, and operational teams. In this guide, we’ll explain how dashboards and scorecards work, compare their features, explore use cases, and help you determine which one best fits your business needs.
What Is a Dashboard?
A dashboard is a visual display of key performance indicators (KPIs), metrics, and data that provides an at-a-glance view of business performance. Dashboards are designed to monitor operations, identify trends, and support day-to-day decision-making.
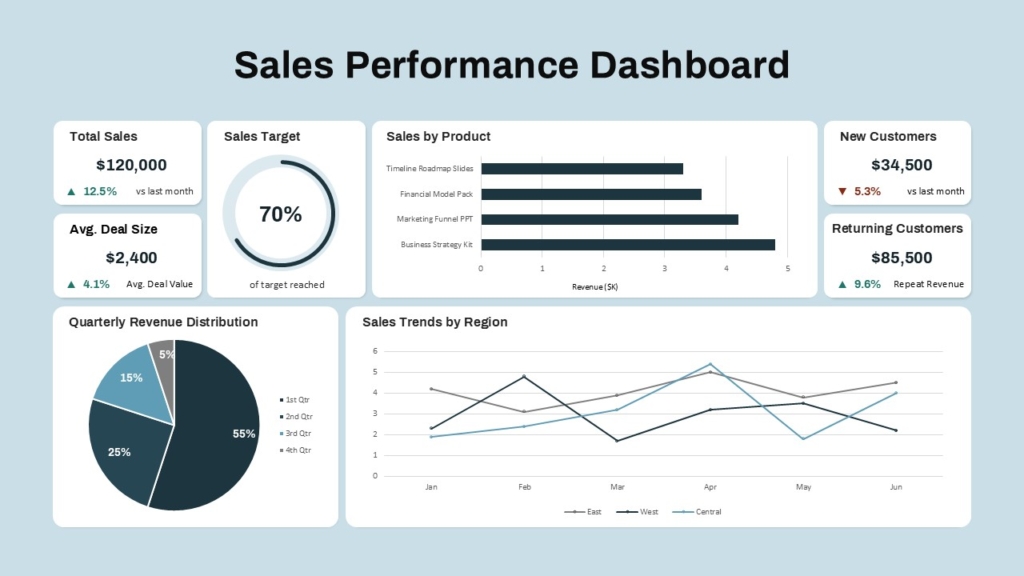
Business dashboards often include:
- KPI cards
- Bar and line charts
- Pie charts
- Tables
- Maps
Dashboards are commonly updated in real time or at regular intervals, making them ideal for monitoring ongoing activities.
Common Dashboard Examples
- Sales Dashboard
- HR Dashboard
- Marketing Dashboard
- Finance Dashboard
- Project Dashboard
What Is a Scorecard?
A scorecard is a strategic performance management tool used to measure progress against predefined objectives and targets. Instead of displaying all available data, scorecards focus on evaluating whether the organization is achieving its goals.
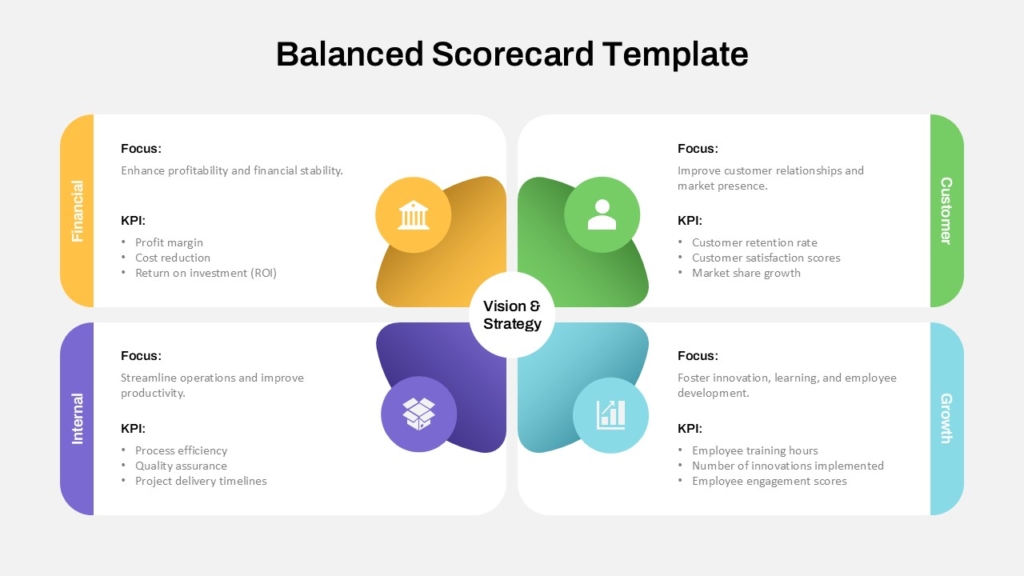
A scorecard typically includes:
- Strategic objectives
- KPIs
- Target values
- Actual performance
- Variance
- Status indicators (red, amber, green)
- Performance trends
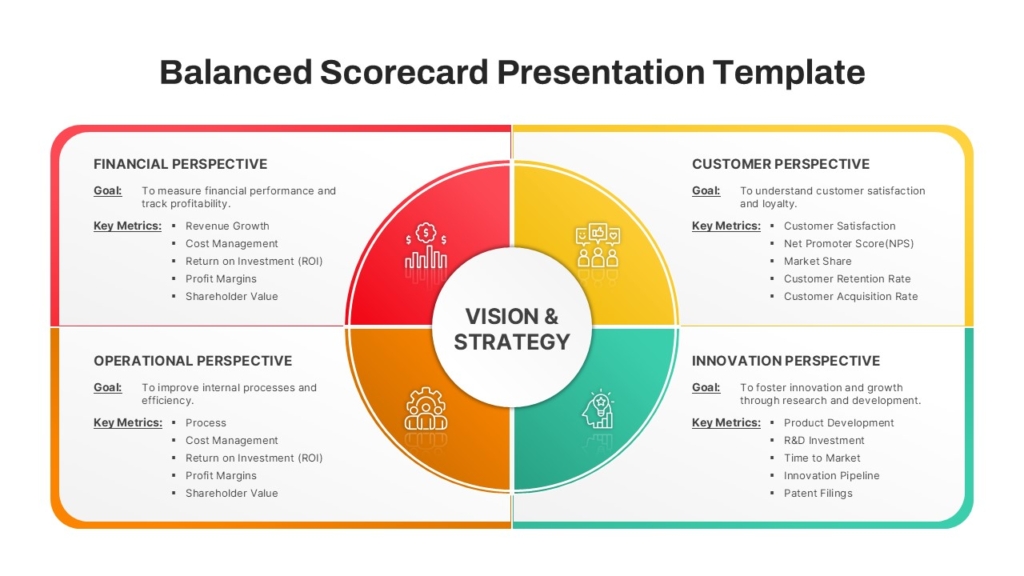
Many organizations use Balanced Scorecards to align departmental activities with long-term business strategy.
When Should You Use a Dashboard?
Scorecards are best for evaluating progress toward strategic objectives.
- Department Performance : Track departmental objectives and long-term KPIs.
- Business Strategy : Measure whether organizational goals are being achieved.
- Performance Reviews : Measure employee or team performance against established goals.
Types of Dashboards
1. Executive Dashboard
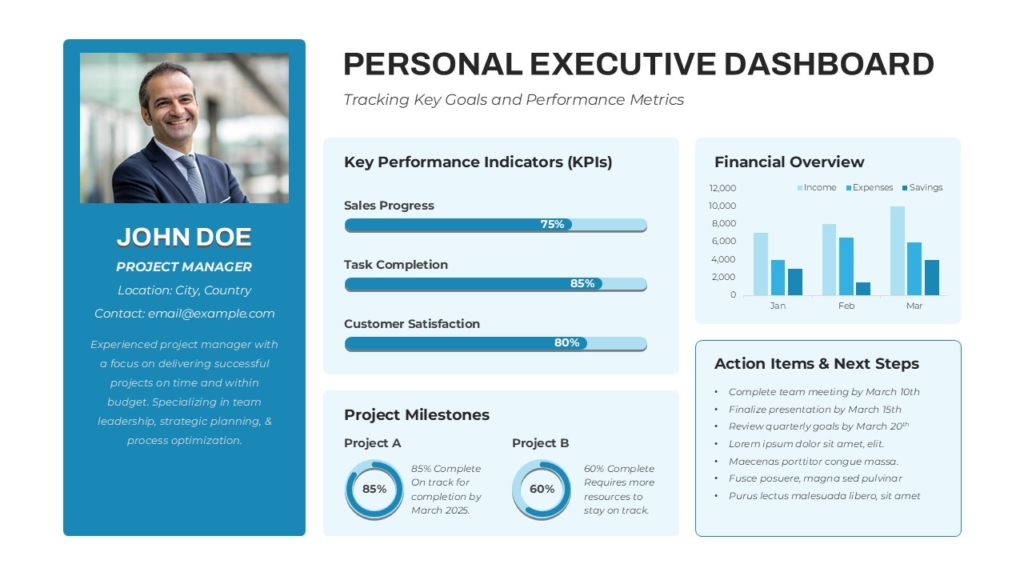
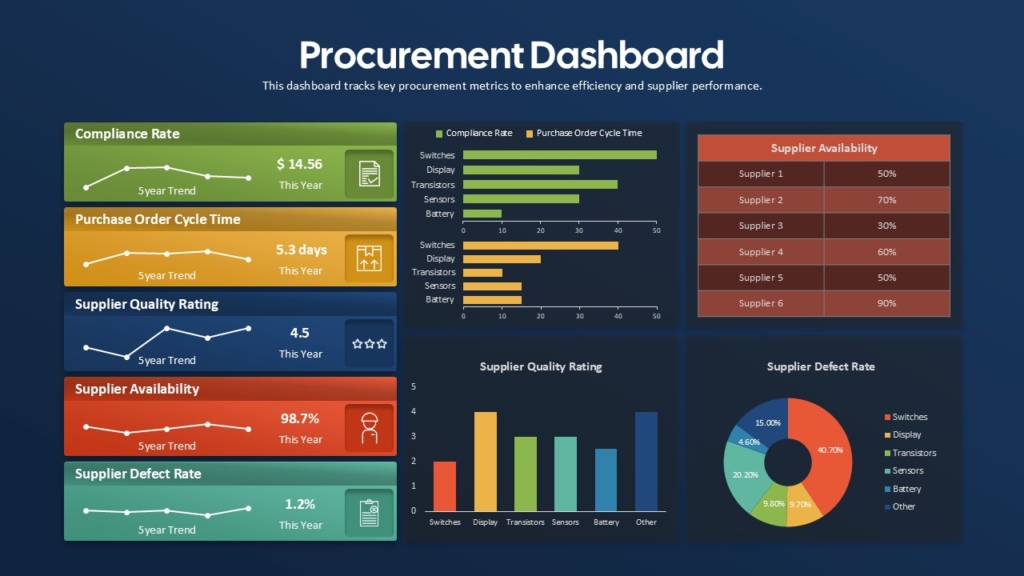
2. Procurement Dashboard
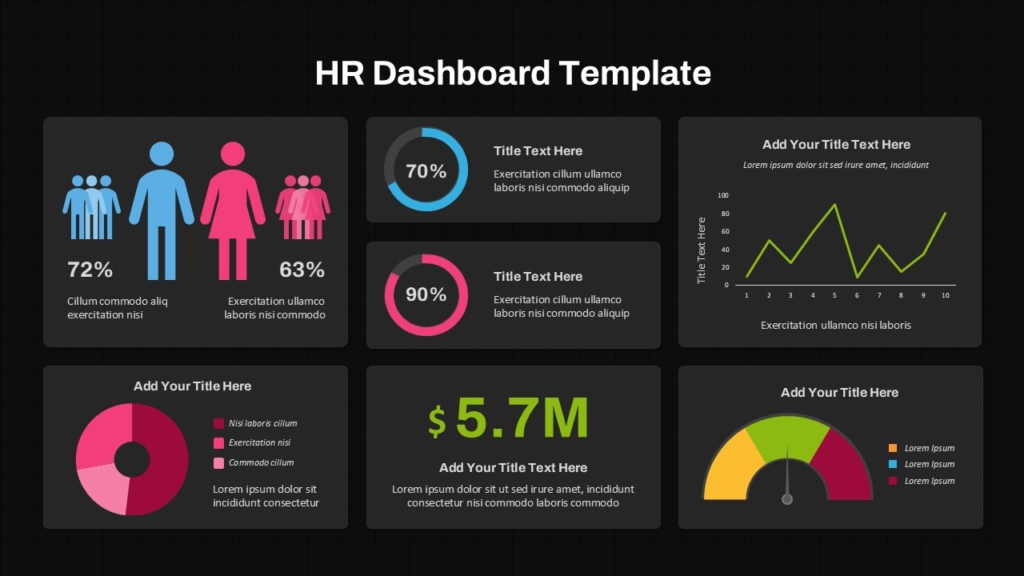
3. HR Dashboard
Types of Scorecards
1. Balanced Scorecard
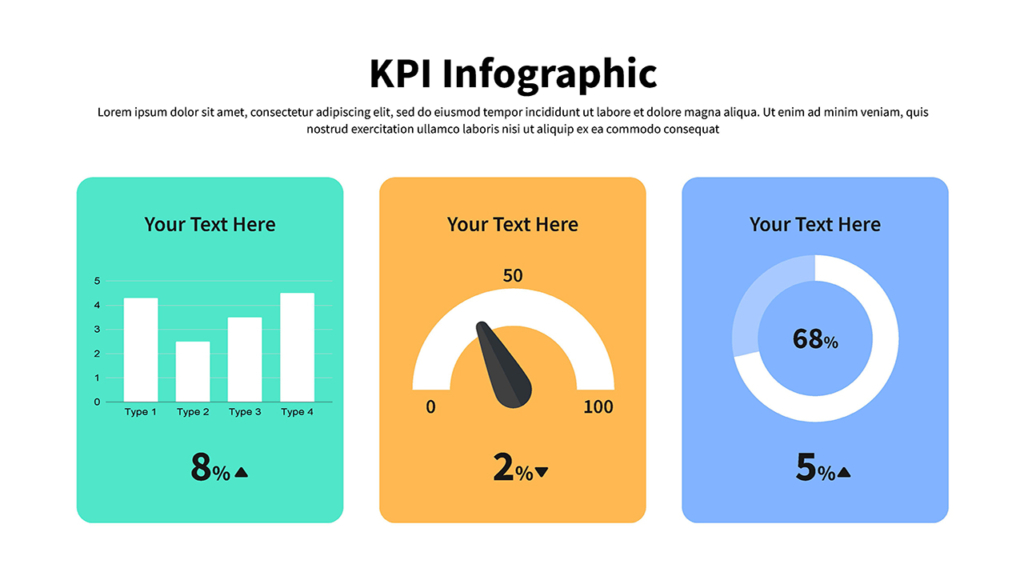
2. KPI Scorecard
Can You Use Dashboards and Scorecards Together?
Yes. In fact, many organizations use both tools to gain a complete view of performance.
For example:
- A dashboard monitors daily sales, inventory, and customer activity.
- A scorecard measures quarterly revenue goals, customer satisfaction targets, and business growth objectives.
Together, they provide both operational visibility and strategic direction.
Conclusion
Dashboards and scorecards are both essential tools for measuring business performance, but they serve different purposes. Dashboards provide real-time visibility into operational metrics, enabling teams to monitor activities and make timely decisions. Scorecards focus on strategic objectives, helping organizations evaluate progress against goals and drive long-term success. Understanding when to use each tool or combining both can improve decision-making, enhance performance tracking, and ensure every level of the organization stays aligned with its objectives.
👉Explore SlideKit’s Dashboard and Scorecard Templates today and create impactful business presentations in minutes.