3D Cylinder Bar Chart PowerPoint Slide
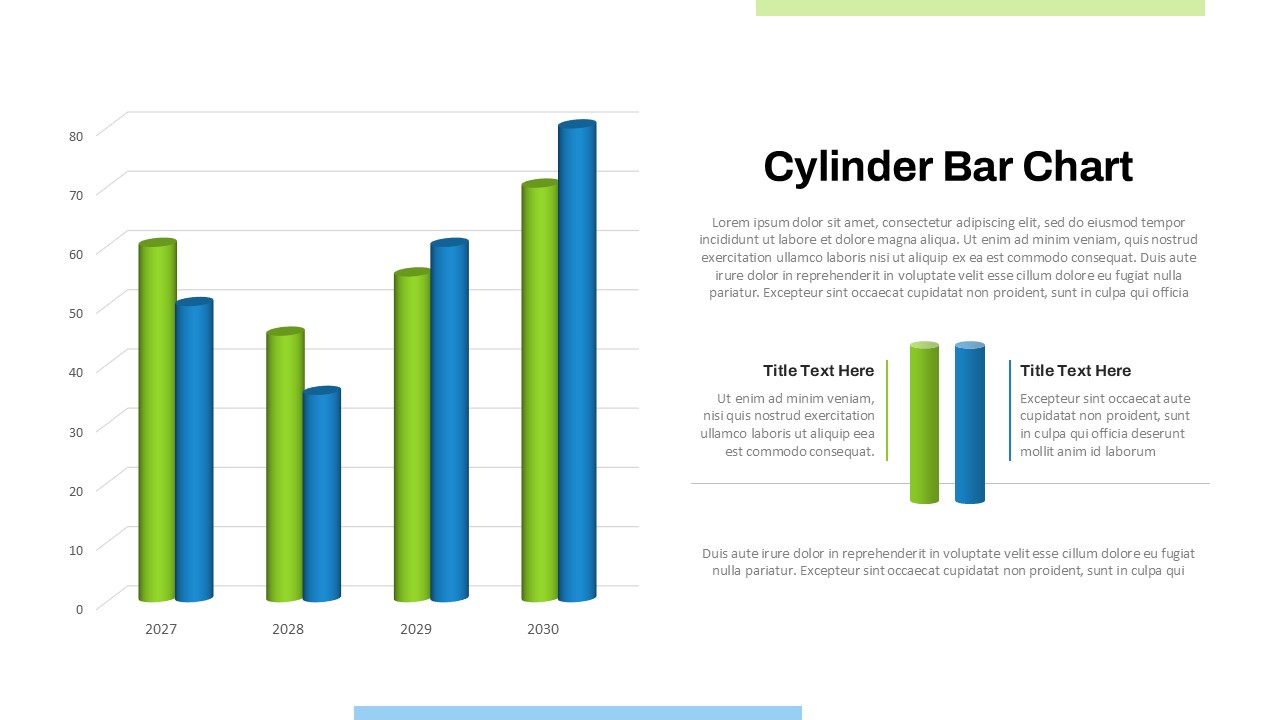
The Best Editable Cylinder Bar Chart PowerPoint Slide Template is a modern and visually appealing tool designed to showcase data in a clear and impactful way. This bar graph in PowerPoint uses cylinder-style bars to represent numerical comparisons, trends, and growth patterns, making it ideal for professionals who need to deliver data-driven presentations.
Whether you're presenting financial forecasts, project performance metrics, sales analysis, or market trends, this template simplifies complex data into digestible visuals. It features fully customizable elements, allowing you to adjust the colors, labels, and values to suit your specific needs. The sleek design ensures your content remains professional and engaging, while the chart’s 3D cylinder format adds a touch of creativity and sophistication to your presentation.
This template provides flexibility for diverse audiences and industries. Its intuitive layout helps viewers easily grasp insights, making it ideal for business meetings, educational seminars, marketing strategies, or internal reporting.
With its blend of style and functionality, this cylinder bar chart template empowers you to convey your message effectively and leave a lasting impression.
See more

