
Bell Curve Chart PPT Template
This template is part of a deck featuring multiple slides. To check out all slides, click on See All.
See All


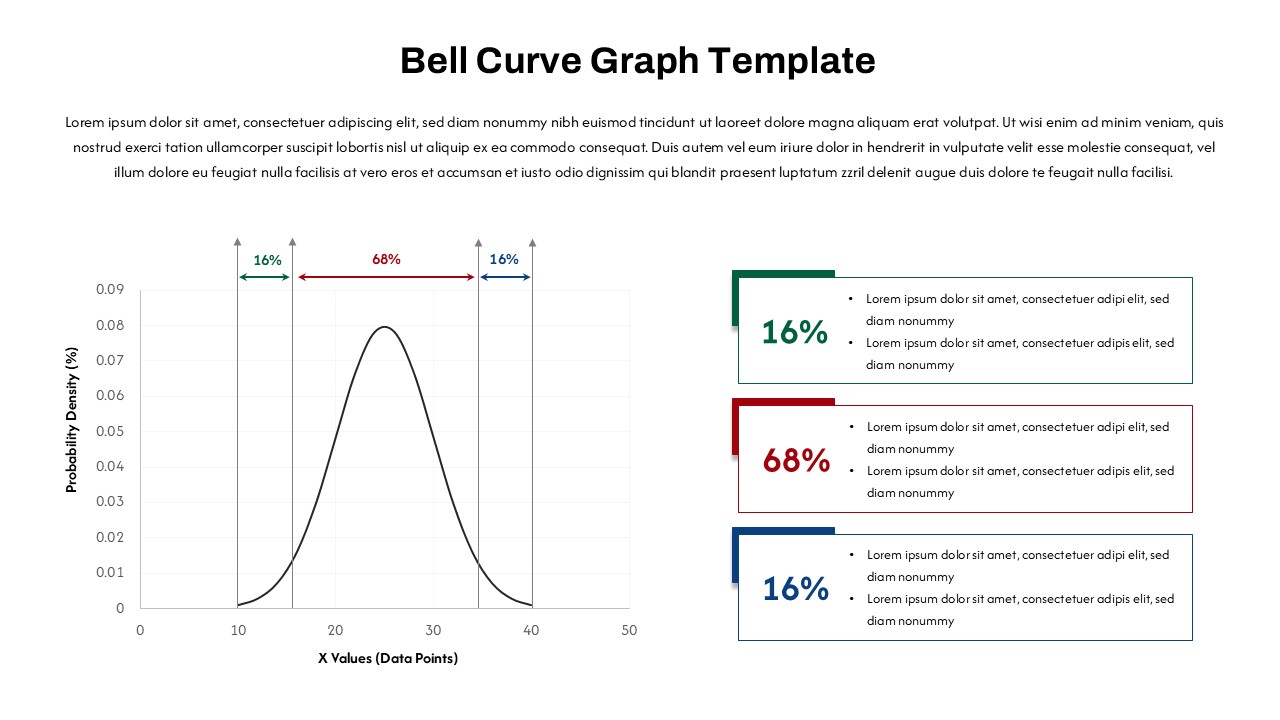
This PowerPoint template features a bell curve graph illustrating a standard normal distribution, with percentages (16%, 68%, and 16%) marked on the x-axis. There are three color-coded sections (green, red, and blue) on the right side of the slide, each corresponding to the 16%, 68%, and 16% areas, with placeholders for adding content or descriptions