Animated 3-Circle Venn Diagram for PPT & Google Slides
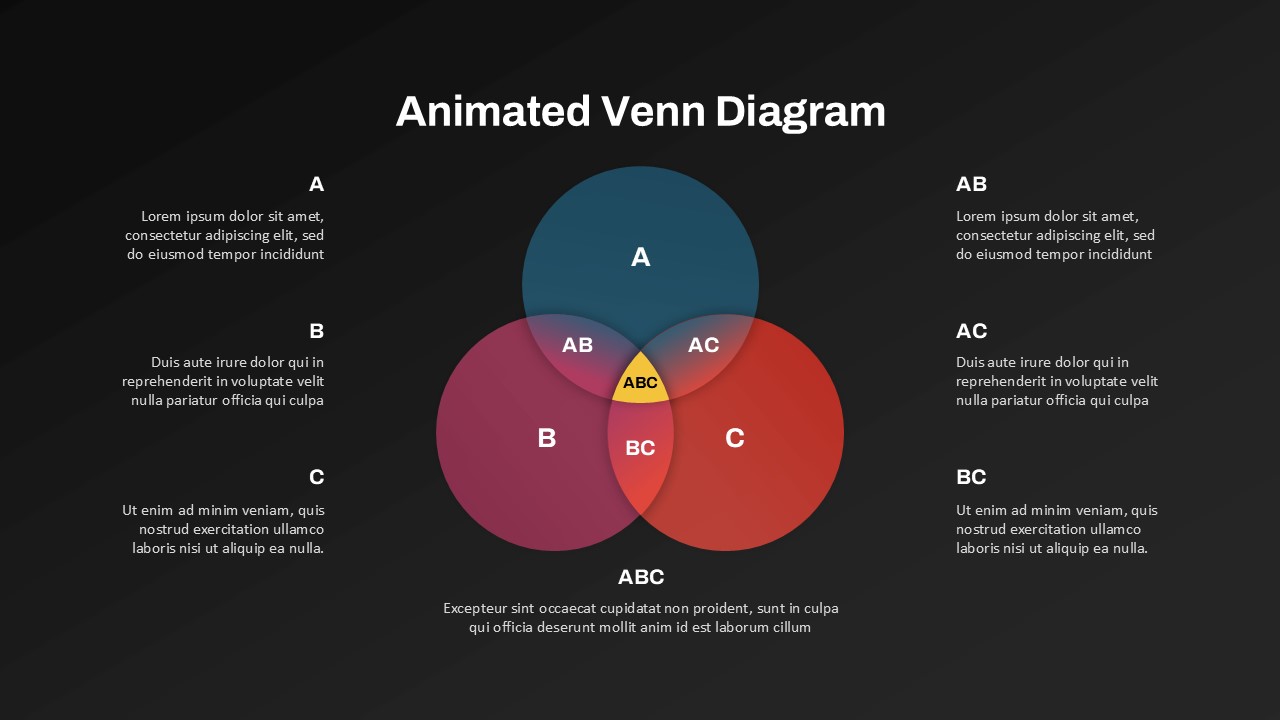
Visualize complex relationships and shared attributes with this Animated 3-Circle Venn Diagram Template, tailored for PowerPoint and Google Slides. This dynamic and visually engaging venn diagram on ppt design presents three overlapping colored circles (A, B, and C), with all possible intersections (AB, AC, BC, and ABC) clearly highlighted. Each section is paired with space for descriptive text, allowing for in-depth explanation of individual segments and overlaps.
Perfectly suited for presentations involving comparisons, group categorizations, or multi-variable analysis, this Venn diagram template brings clarity to complex ideas. The animated effect enhances audience engagement by sequentially revealing each segment, making it easier to focus attention and build understanding step by step.
The dark background provides strong contrast, making the vibrant circular intersections stand out with clarity. Each zone—whether exclusive or shared—can be used to communicate distinctions, interdependencies, or synergies among three elements or categories. Fully editable, the venn diagram template with 3 circles allows customization of colors, labels, animations, and text to suit diverse presentation needs.
Ideal for educators, business strategists, analysts, marketers, and consultants, this template transforms abstract relationships into impactful visual narratives. Whether explaining a product mix, stakeholder alignment, data intersections, or research outcomes, this animated Venn diagram slide delivers a professional and compelling presentation experience.
See more

