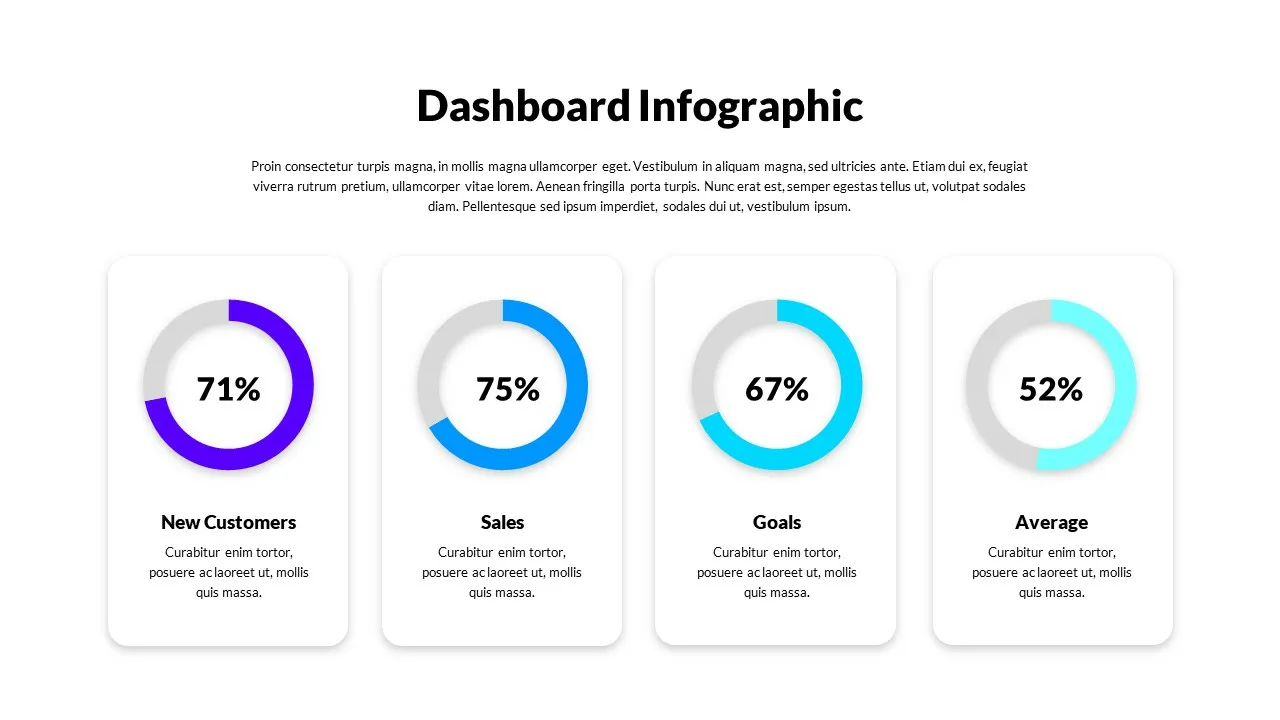
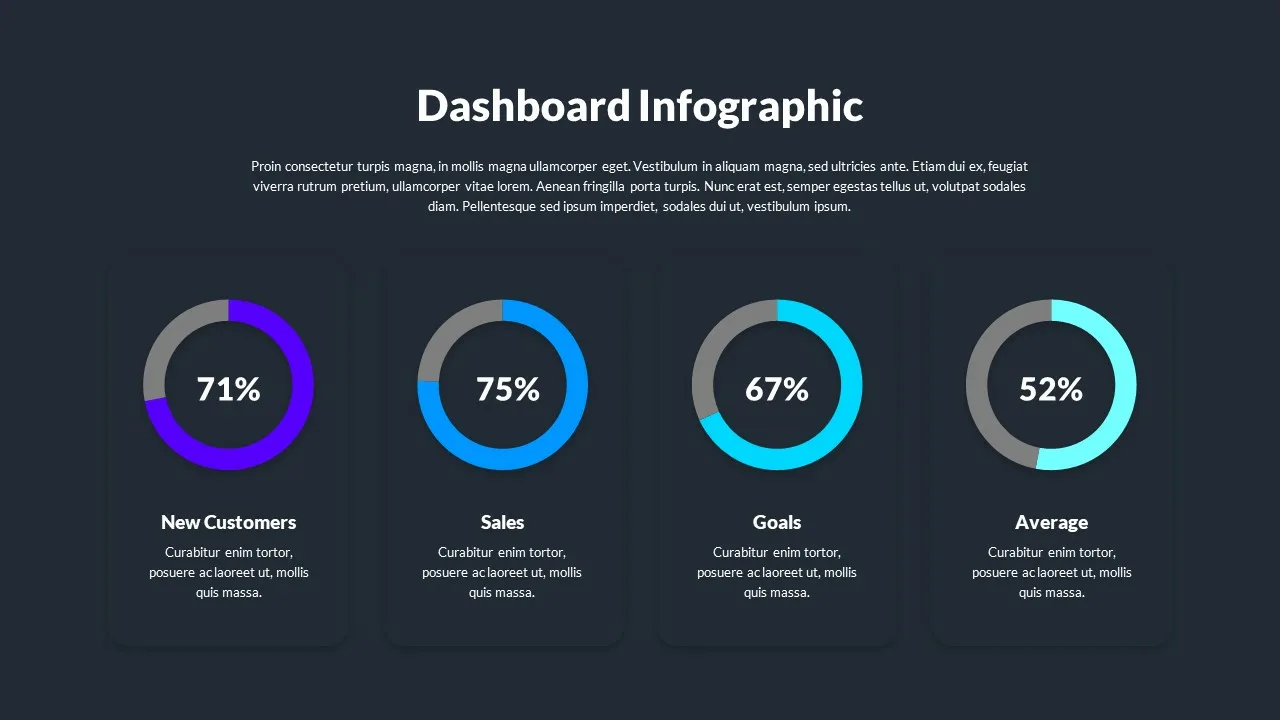
The presentation dashboard template contains doughnut chart designs for the google slides theme. The four data distribution charts have different values shown by simple graphs. For example, it could be a sales report presentation slide with visual data on new customers, sales, goals, and averages.
Dashboard infographic has two slides in the black and white background color themes. Using the donut chart presentation template, you can divide your data presentation into four groups. Alternatively, you can use complex dashboards and data-driven graphs for financial presentations. Presenters can show the complete data using a chart, which also helps in easy analysis. Download these google slides templates now!
Try Our Google Slides Add-On and Get Access to 4500+ Slides
-

No. of Slides
2 -

Aspect Ratio
16:9 -

Item ID
SKT00227 -

Category
Google Slides Infographic Template