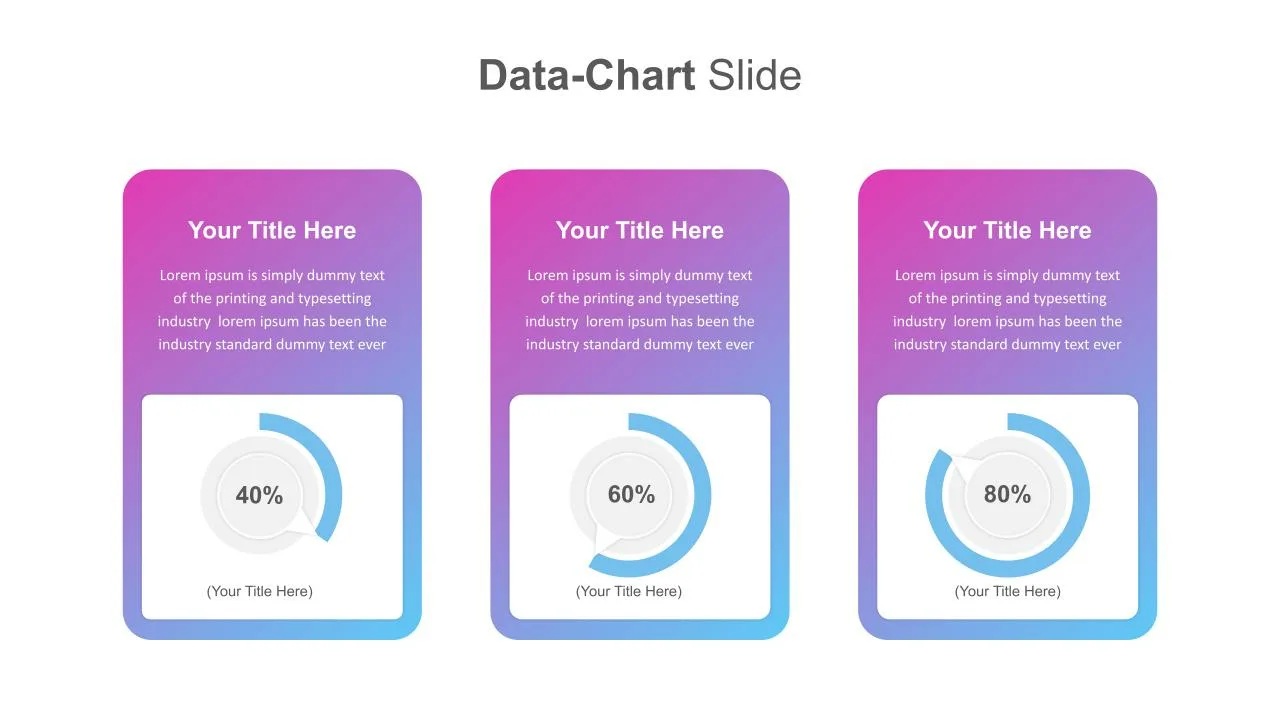
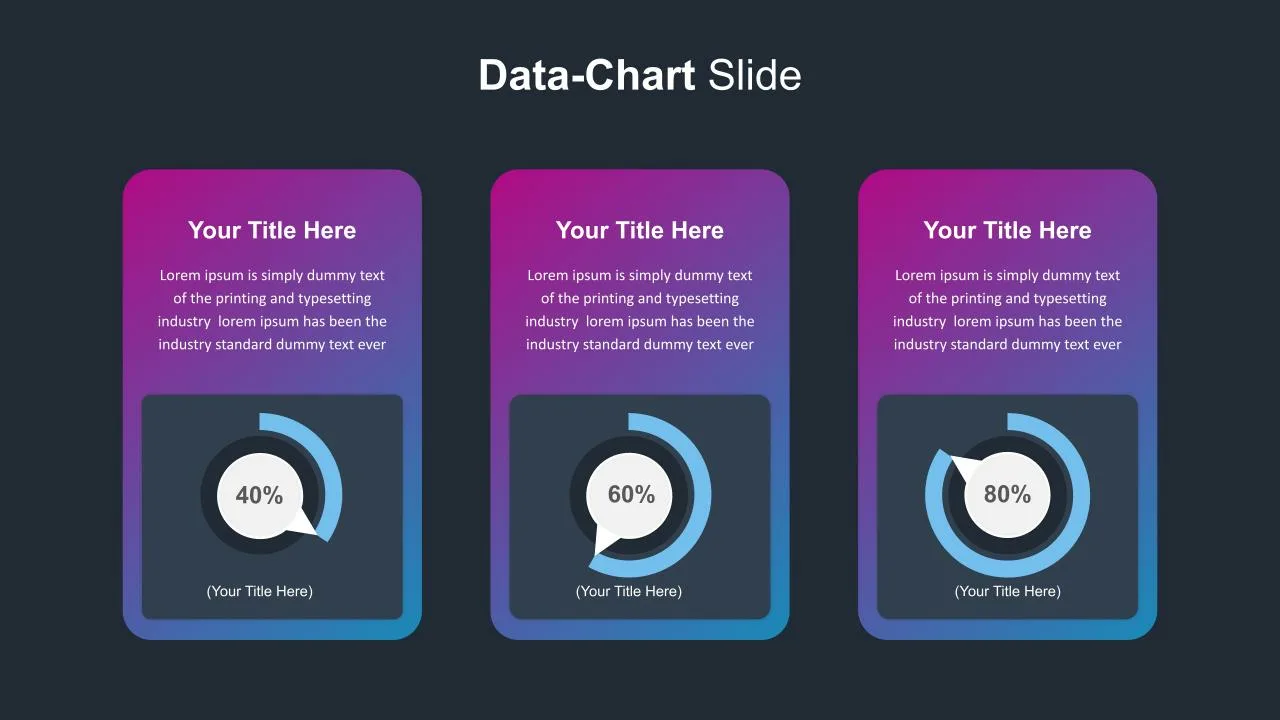
The statistics google slides theme in a donut chart design allows you to present distribution in averages. This is a flexible chart that helps to convey accurate facts in an easily understandable fashion. Normally data presentation templates will have more than one set of means for transmitting data. A doughnut chart is the simplest form of a pie chart, with a center hole resembling a donut. This statistics presentation google slide is best for presenting percentages using the color distribution. The template has pink and blue duotone color schemes, ensuring the audience’s maximum attention. Get this aesthetic and attractive data chart slides now!
Try Our Google Slides Add-On and Get Access to 4500+ Slides
-

No. of Slides
2 -

Aspect Ratio
16:9 -

Item ID
SKT00351 -

Category
Google Slides Infographic Template